Support and Service Use Case
A guide to implementing Auto Insights for a support and service use case, including data structure and sample questions.
Problem Statement
Support and service teams would typically want to manage their team workloads, determine which teams need more staffing, determine which teams always have a long case duration, and determine which types of cases can be reduced with self-service knowledge base articles.
Typically, these insights would be required to be monitored daily or weekly, with some insights raised at a monthly management meeting for decision-making.
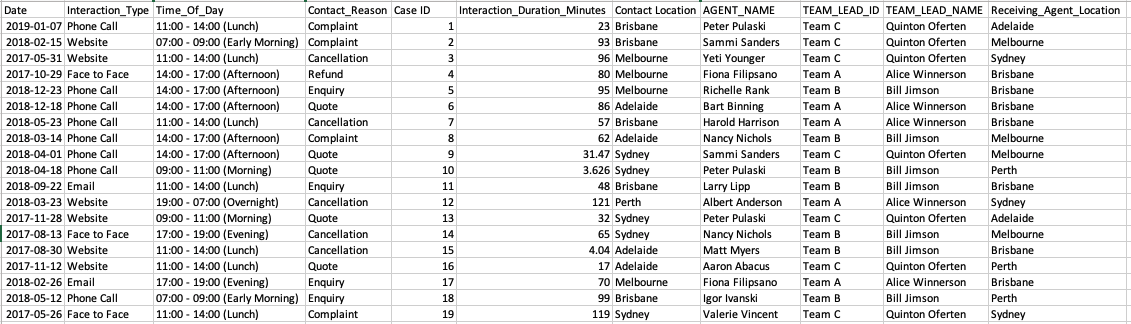
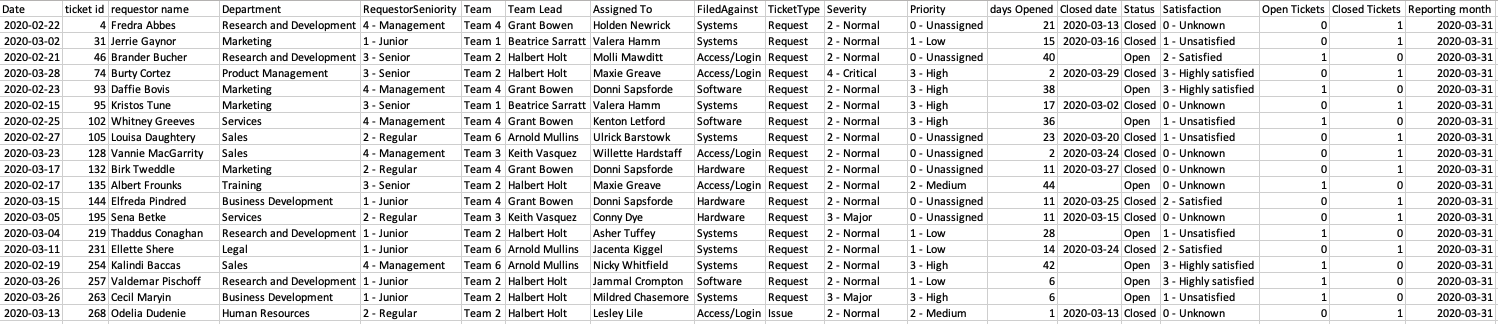
An Example of Support and Service Data Structure
Right-click and 'open image in new tab' to expand the view.
Call Center:
Service Ticket Desk:
Segments
A segment is a qualitative value, like names or categories. Here are some of the typical segments we find in support and service data:
Case attributes: Case Resolution, Case Type, Outstanding Days Bracket, Time of Day, Priority, etc.
Team attributes: Team, Department, Agent, etc.
Other attributes: Channel, etc.
Measures
A measure is a quantitative, numeric value. Here are some of the typical measures we find in support & service data:
Case Metrics: Case Duration, Closed/Open/Reopen Count, Escalation Count, Outstanding Days, Interaction Duration
Team Metrics: Average Case per Team, Average Case Duration per Team, Number of Cases
What Sort of Insights Can Auto Insights Help Me Uncover?
Identify Patterns
Number of Cases against products this month compared to last month
Outstanding Days by Case Type this week
Number of Cases filtered for Open Status by Case Type yesterday
Explore Team Performances
Total Outstanding Days by Teams this week
Number of Cases comparing the Outstanding Days bracket
Number of Cases specific for Complaints by Teams this week
Reopen Count by Teams this month
Escalation Count by Teams this month
Average Case per Team this week