Implement a Google Analytics Use Case
A guide to implementing Auto Insights for a Google Analytics use case, including data structure and sample questions.
Auto Insights can help marketing and sales teams automate website performance analysis, drill into website visits, page views, sessions, or user trends as well as spot anomalies and outliers. However, it is important to note that the raw data from Google Analytics will require some data work to get it ready for Auto Insights.
This article will cover:
Example insights from this use case
Recommended data structure for this use case
What Sort of Insights Can Auto Insights Help Me Uncover?
We've outlined some example questions to provide an indication of the types of insights you can expect with Auto Insights:
Acquisition Performance Analysis
Visits by source this quarter
Year-to-date trend in visits from mobile devices
Visitors by city this month
What’s driving trends in the number of bounces
Bounce rate by source
Number of entrances by page path
Behavior Trends and Analysis
The average number of page views per visit
Average visit length by city
Average time on the page-by-page path
Top page views by page path
Exit by page path
The average number of sessions per user
How Do I Structure My Data?
Auto Insights requires structured, transactional data, with at least 1 measure (e.g., Spend) and 5 segments (e.g., source of visit). In addition, we recommend at least 7 months of data (at monthly or daily granularity) so you can take full advantage of Auto Insights' Unexpected Changes feature.
For Google Analytics data, it is likely that some additional steps to categorize data for Auto Insights' Natural Language Processing (NLP) will be required.
Example Data Structure
Please click on the picture to download a larger copy of the image.
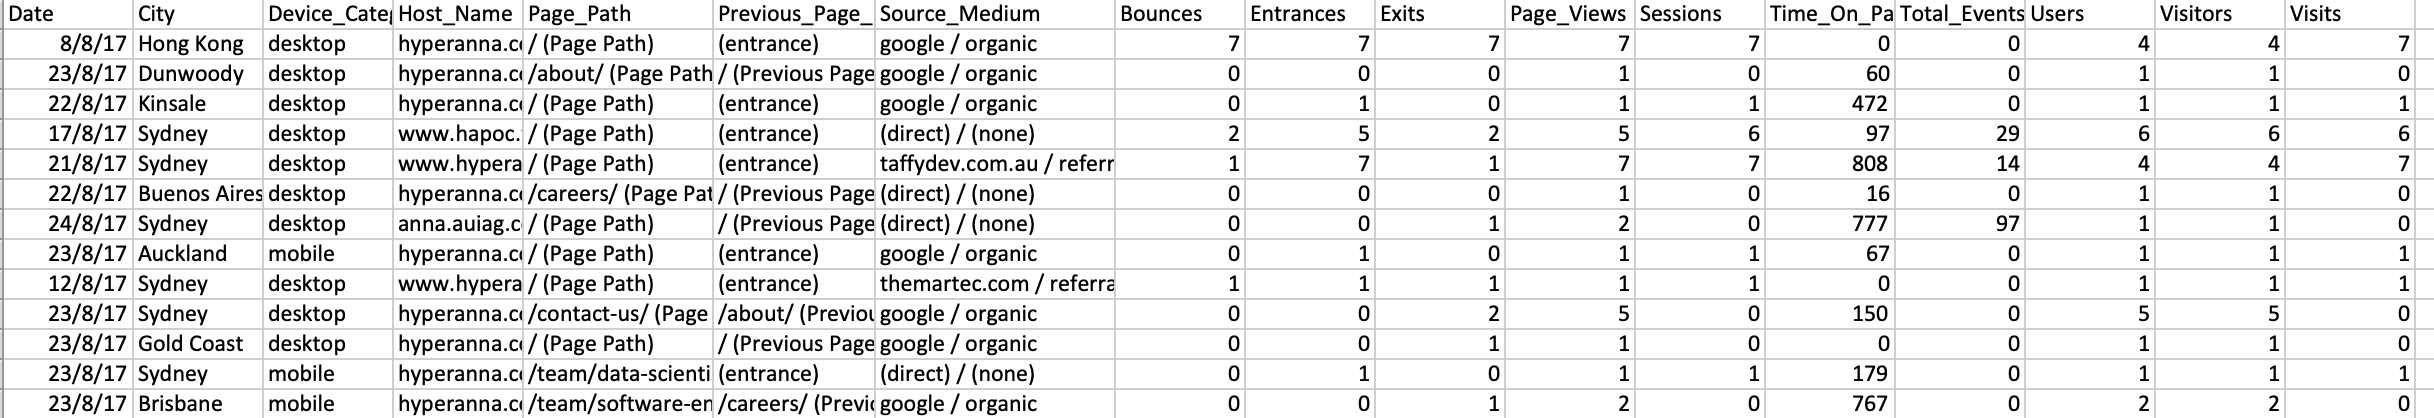 |
Segments
Here are some of the typical segments we find in Google Analytics data. A segment is a qualitative value, like names or categories:
City
Device Category (desktop, mobile, tablet)
Host name
Page Path
Previous Page path
Source / Medium (e.g., referrals from sites like LinkedIn, or from email campaigns)
Measures
A measure is a quantitative, numeric value. Some of the typical measures include:
Bounces
Entrances
Exits
Page views
Sessions
Time on Page
Total Events
Users
Visitors (unique visitors)
Visits (number of visits)
Bounce Rate
Session length
Visit Length
Any Recommendations on the Process to Extract and Transform the Data?
Step 1: Extract
You may need to use a specific tool or solution to help you securely and reliably move data from Google Analytics into your databases, warehouse, or lake. Please reach out to us if you have any questions on this.
Step 2: Transform
Once you’ve extracted your data, you may need to make some further transformational changes. This can either be done in your database itself or by creating an SQL query in Auto Insights.