Dataset Access
Nota
This article pertains to datasets created via the Auto Insights Admin Portal or via Designer Desktop using the Auto Insights Uploader tool.
Datasets created from a Alteryx One Platform dataset cannot be shared via Groups in the Admin Portal. To share datasets created from Alteryx One Platform, see Share Dataset.
Dataset Admin Process Flow
The following graphic outlines the sequence of steps required for dataset administration. As an admin, you create groups, add users to those groups, and then assign permissions.
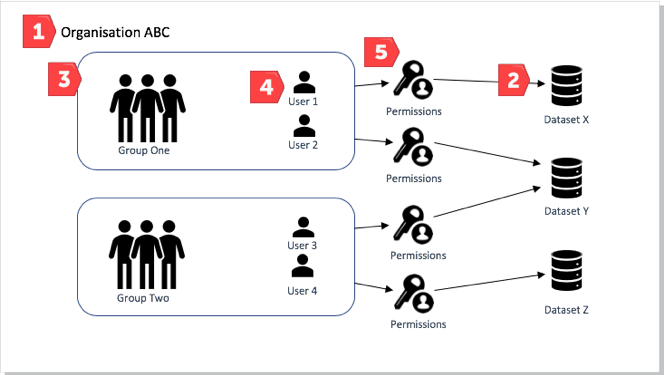
Dataset Access
Auto Insights uses Groups to provide access to a dataset. For each dataset, you can set the following access for Viewers and Owners in that group.
Capability | Viewer | Owner |
|---|---|---|
View Dataset and Insights | ✓ | ✓ |
Configure Dataset Settings | ✓ |
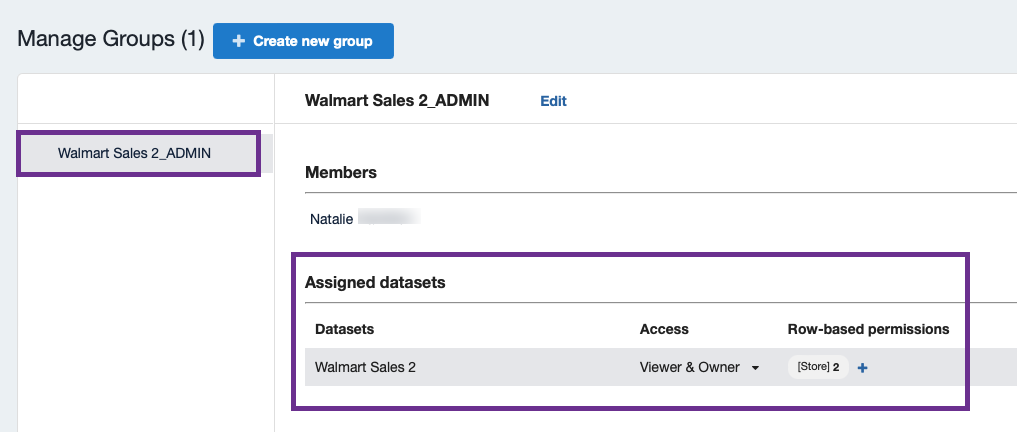
To set group dataset access, go to Admin Portal > Groups. Select the group to edit, then select Viewer & Owner or Viewer from the dropdown. See the next section to learn about Row-based permissions.
Dataset Access for Synthetic Data from Playbooks
Synthetic datasets can be created by non-admin users as part of the Playbooks feature, making them the owners of the dataset. Because non-admin users do not have access to the Admin portal and therefore cannot grant access to their datasets to other users.
In this case, if a non-admin creates a Mission based on a synthetic dataset as part of the Playbook process and then wants to share the Mission and the dataset with someone else, the request for the dataset access goes to the Organisation Admin, who can grant access to all datasets within the organization.
Show Underlying Data
This feature allows users to see the underlying line-level raw data for a specific insight shown in Auto Insights to get all the information about this particular insight. This feature is available in Missions and Search.
Nota
This feature has to be turned on by a Workspace Admin.
Turn On the Underlying Data Feature
To turn on this feature for your workspace...
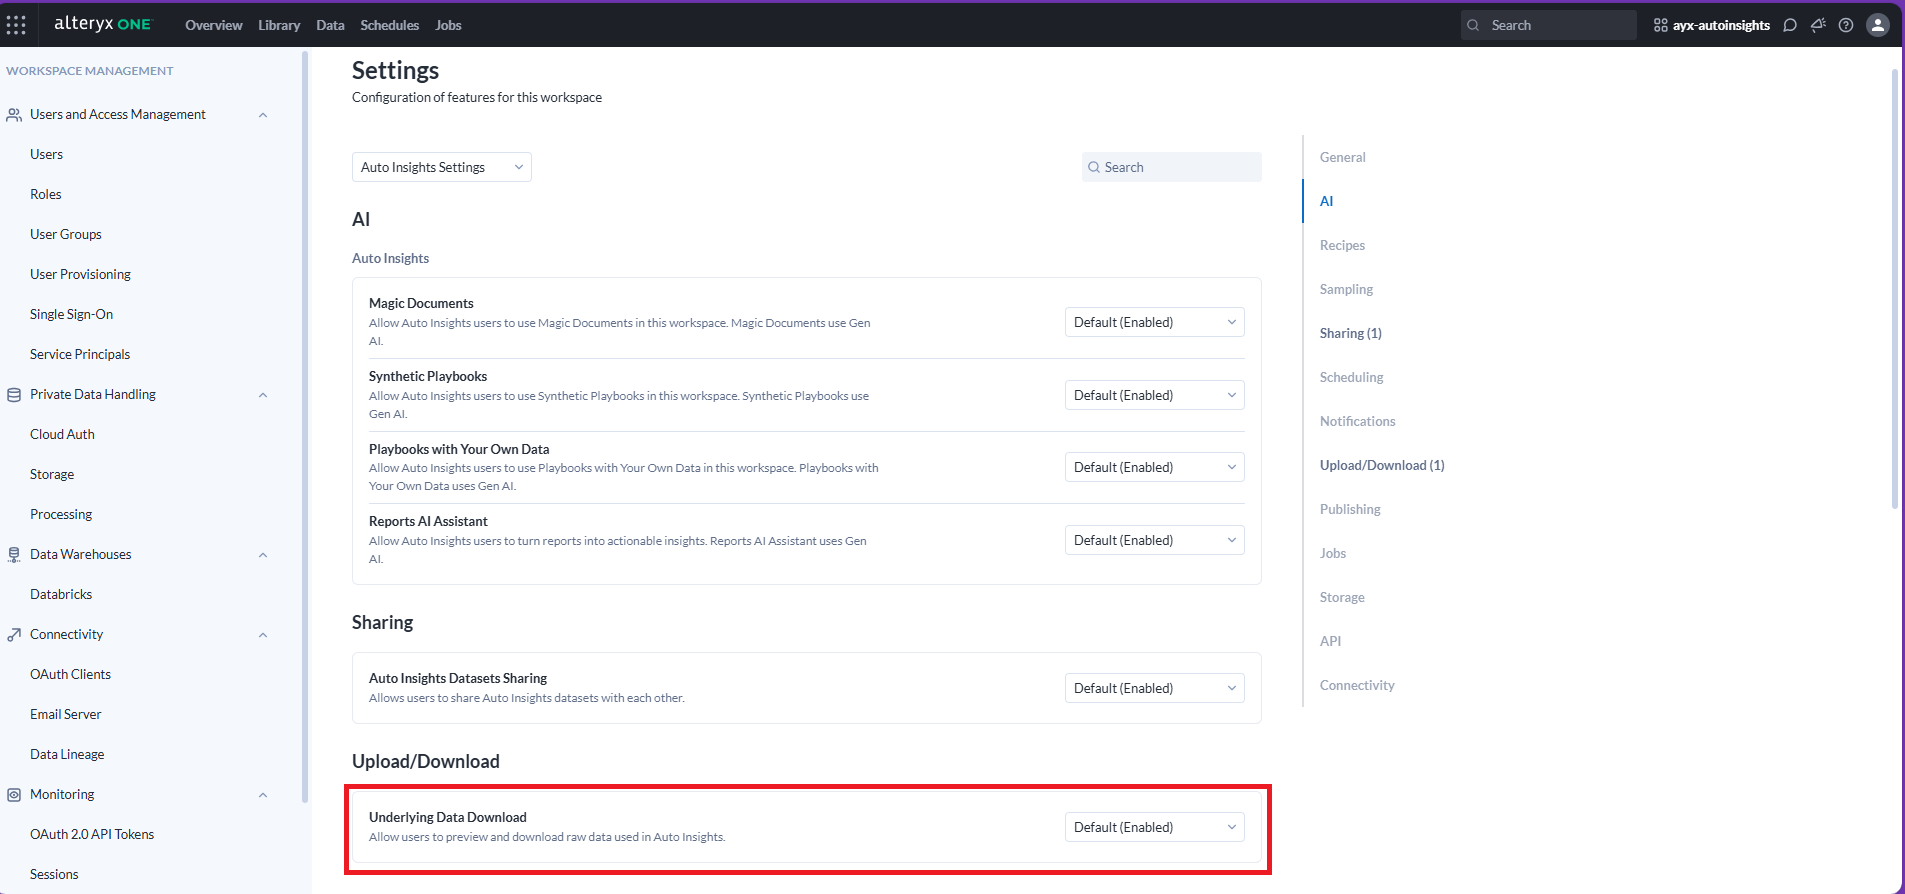
Go to your Profile menu and select Workspace Admin > Settings.
From the dropdown, select Auto Insights Settings.
Turn on the Underlying Data Download feature by selecting Enabled from the dropdown.
Now, dataset owners can allow users to preview and download the underlying raw data for a specific insight on a per-dataset level.
The dataset owner can also disable this feature for a dataset. Then users can’t preview or download the underlying data. Users can't download the entire dataset even if preview and download are enabled. It is only a subset of data tied to a specific insight.
How-To for Dataset Owners
On the Datasets page, select the 3-dot menu next to your dataset, and select Configure dataset.
Navigate to Advanced settings in the left navigation bar.
Go to the Underlying data section, and select Enabled from the dropdown.
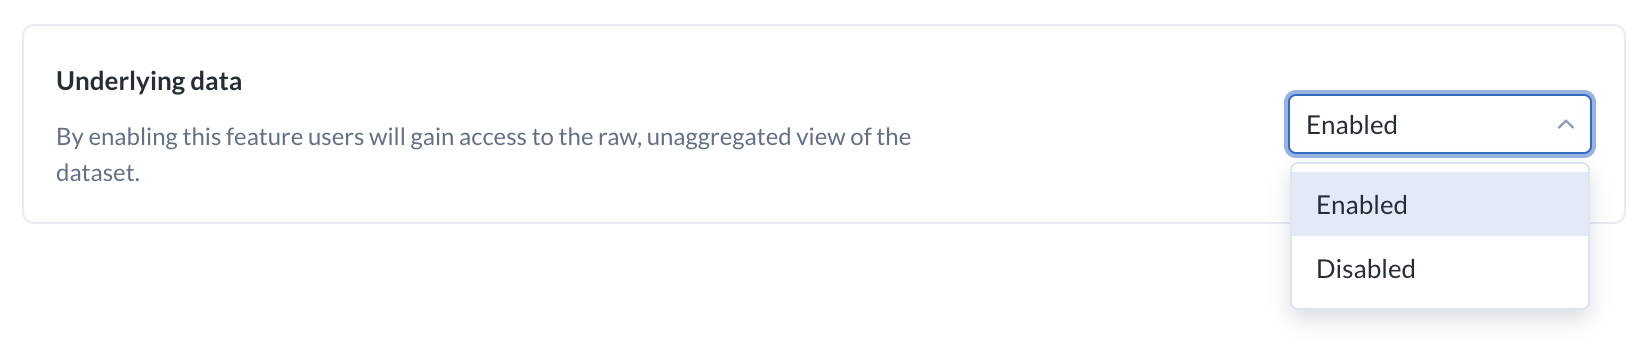
Now, users can preview and download the underlying raw data for a specific insight on a per-dataset level.
On the Datasets page, select the 3-dot menu next to your dataset, and select Configure dataset.
Navigate to Advanced settings in the left navigation bar.
Go to the Underlying data settings section, and select Disabled from the dropdown.
Once disabled, users can’t preview or download the underlying data. Users can't download the entire dataset even if preview and download are enabled. It is only a subset of data tied to a specific insight.
How-To for Users
Go to a Mission page.
There are 2 ways to see underlying data:
Select the ellipsis icon (...) in a table row, then select Show underlying data.
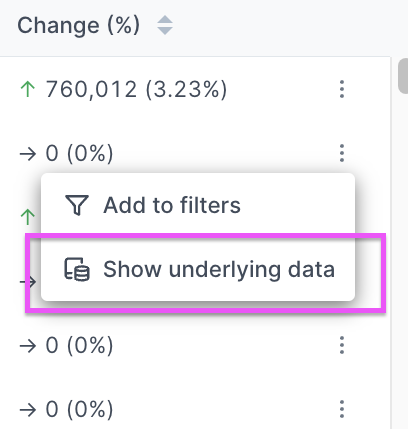
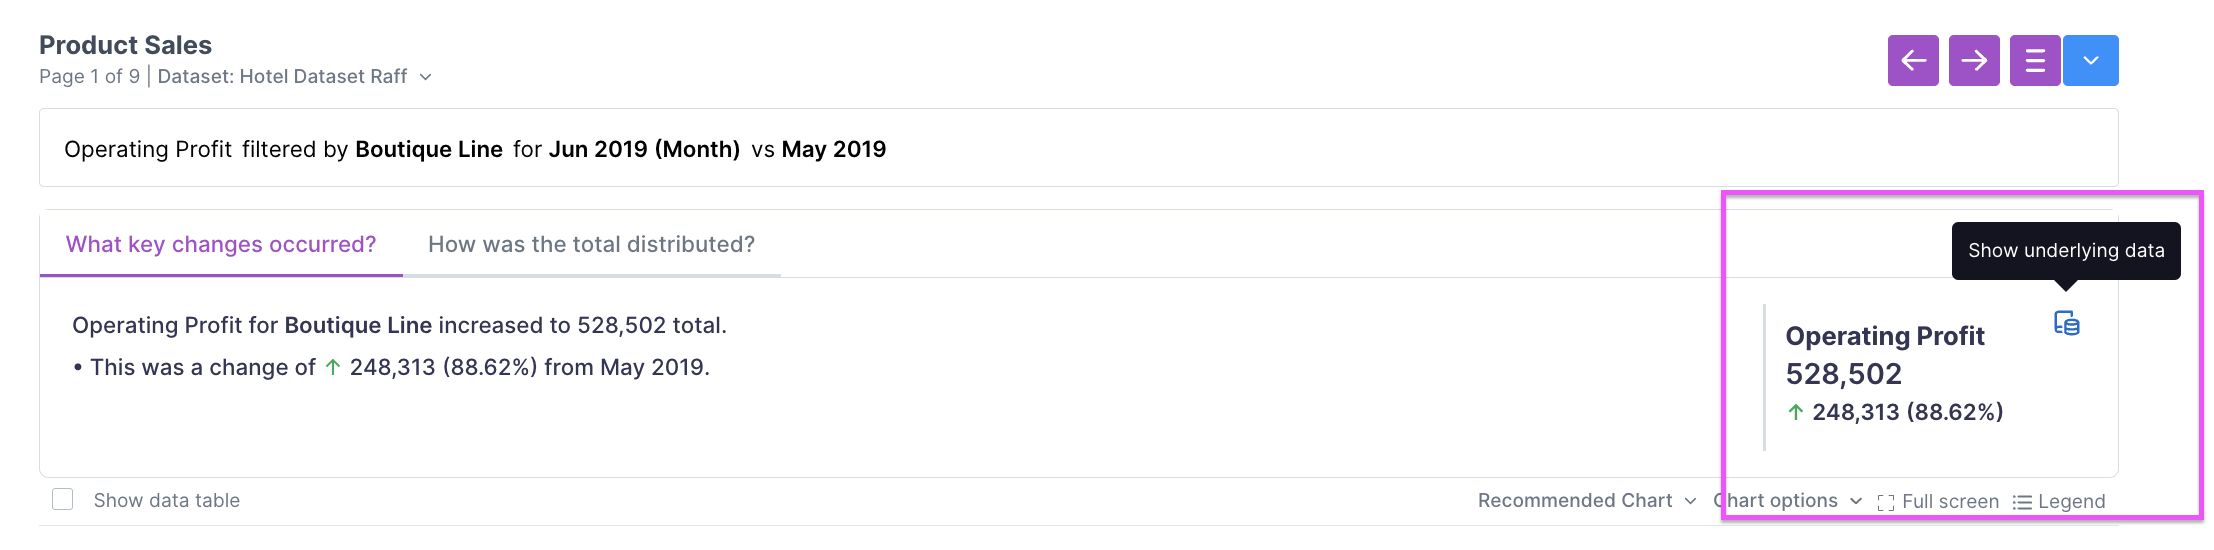
Select the show underlying data icon.
A preview window opens with the line-level table view of the raw data (max 1,000 rows).
(Optional) Download the data in CSV format (max 100,000 rows).
Go to Search.
There are 2 ways to see underlying data:
Select the ellipsis icon (...) in a table row, then select Show underlying data.
Select the show underlying data icon.
A preview window opens with the line-level table view of the raw data (max 1,000 rows).
(Optional) Download the data in CSV format (max 100,000 rows).
FAQ for Users
What are the limitations?
Preview: 1,000 rows
Download 1 CSV: 100,000 rows and 50 columns
Download 2 CSVs: 50,000 rows and 50 columns each
What about when a user has a custom measure, count, or average selected?
Auto Insights still shows the underlying data, but will display a warning message that those measures are not 1:1 displayed in the raw data, as they require additional calculation on top of the raw data. Auto Insights performs those calculations upon ingestion of data.
What happens when the data comes from 2 different datasets (for example, Common Causes)?
Upon download, you will receive 2 CSV files, each containing a maximum of 50,000 rows. In the preview, you will see two tables.
Does this work for goals (target) datasets?
No. You can't preview or download the underlying data for goals (target) datasets.
Is a disabled column visible for preview or download?
If the dataset owner disabled a column during ingestion, it is not visible for preview or download.