Create Missions
You can create Missions manually or use a template. We call the templates magic Missions because they do all the work for you in seconds!
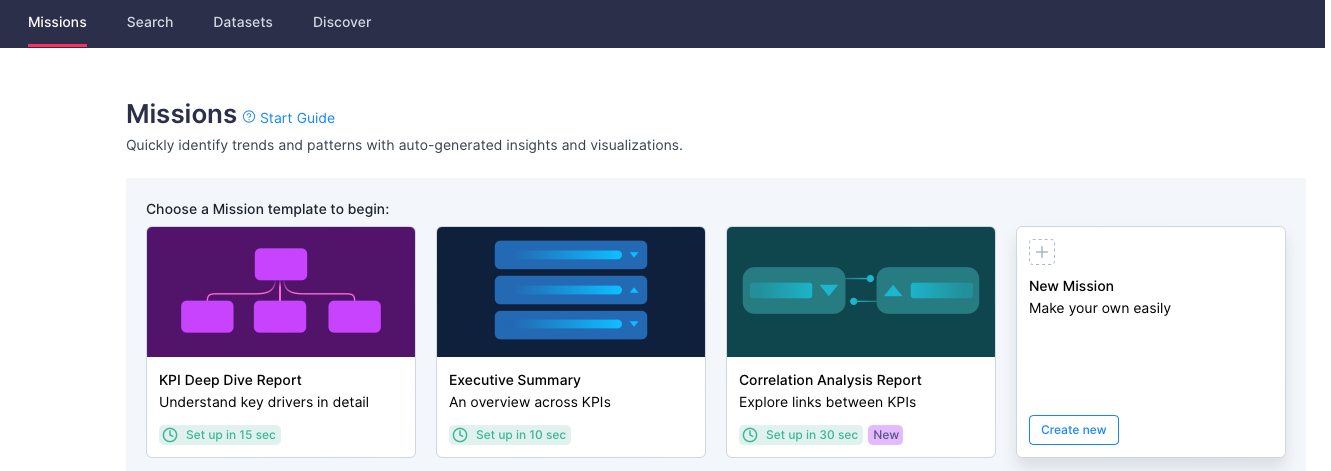
To create a Mission, go to the Missions page.

Select 1 of the template options: KPI Deep Dive Report, Executive Summary, Correlation Analysis Report, or New Mission. See the Create Missions article for more details.
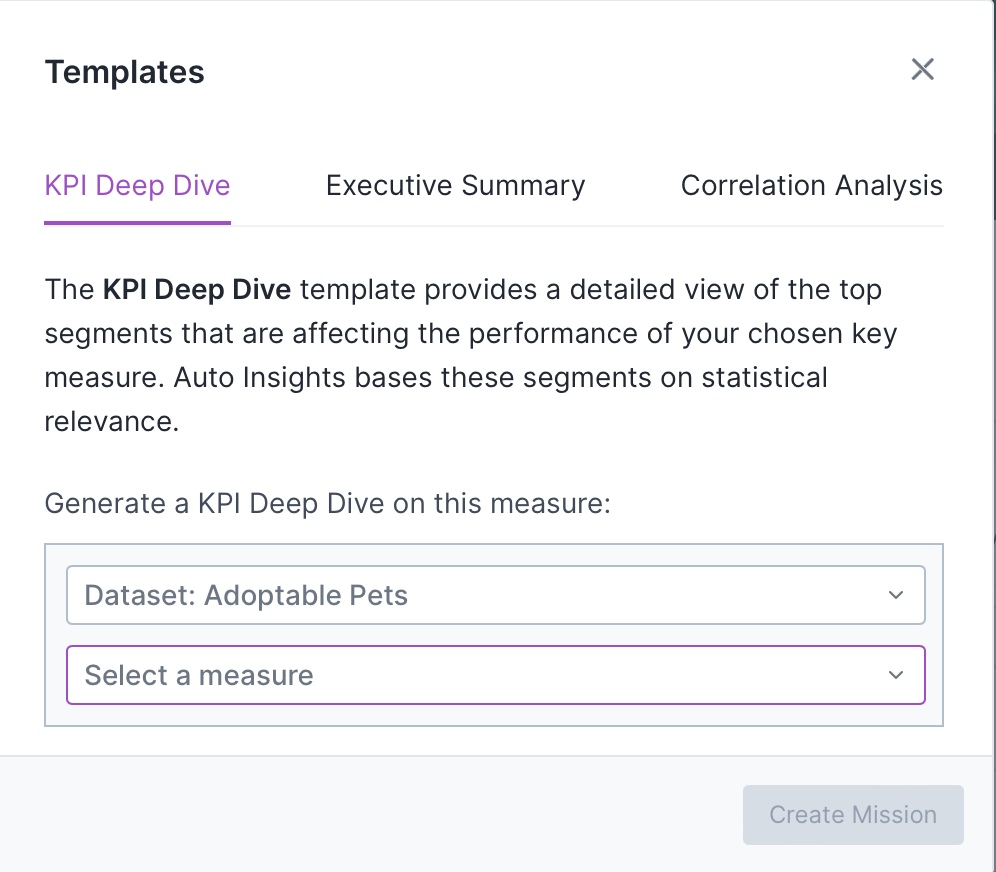
Use the KPI Deep Dive Report—confirm or select your dataset and Select a measure. Then, select Create Mission. Auto Insights names your new Mission with the date and time stamp. You can change it on the Summary page.
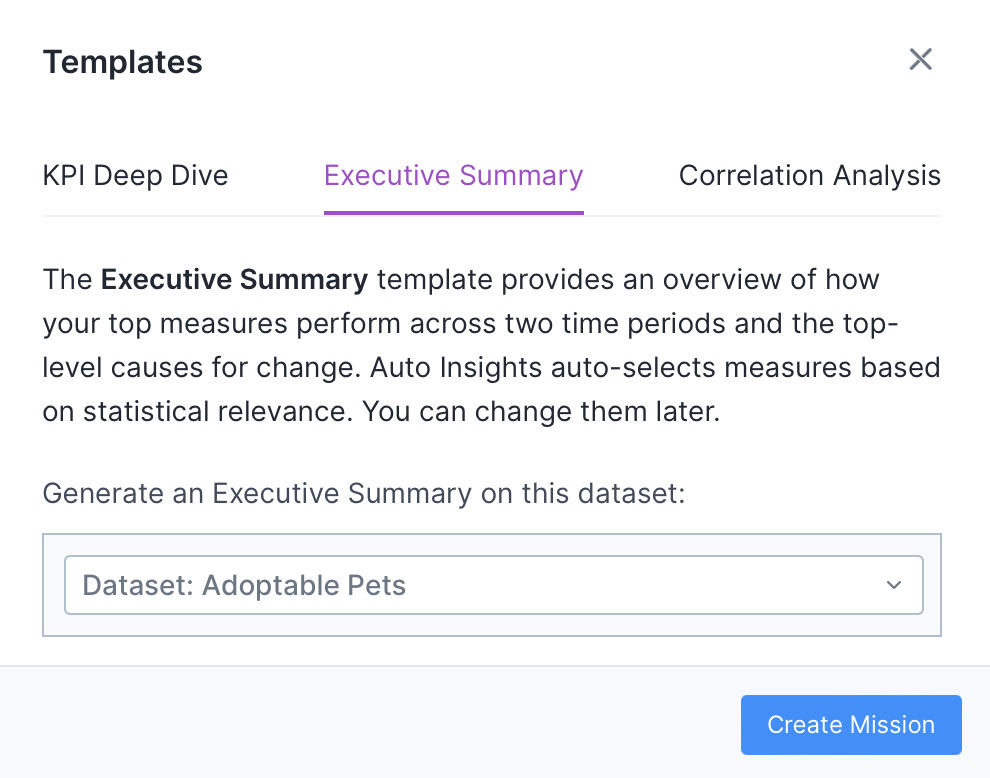
Use the Executive Summary template option—confirm or select your dataset, then select Create Mission. Auto Insights names your new Mission with the date and time stamp. You can change it on the Summary page.
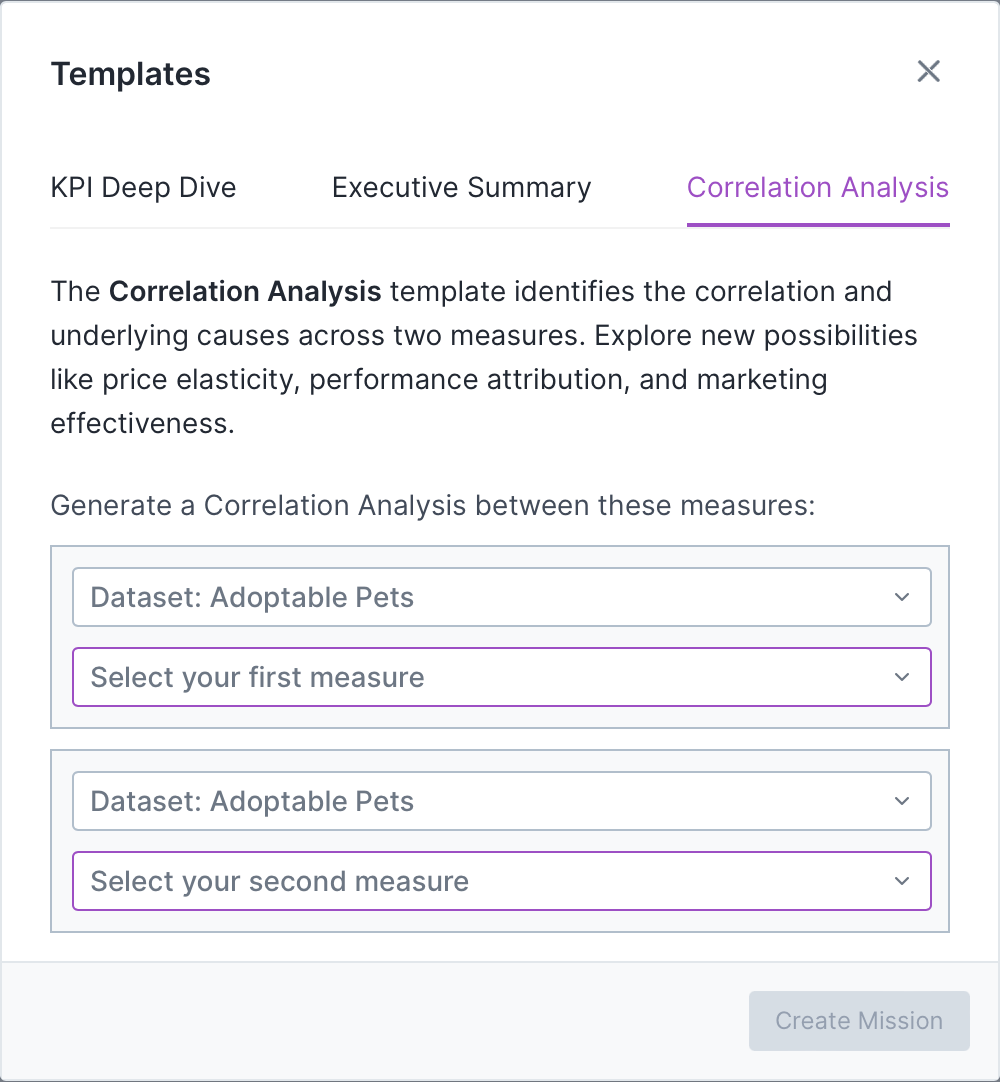
Use the Correlation Analysis option—confirm or select your datasets, and select your 2 measures. Then, select Create Mission. Auto Insights names your new Mission with the date and time stamp. You can change it on the Summary page. Note that Correlation Analysis does not work if you use a dataset without time series data.
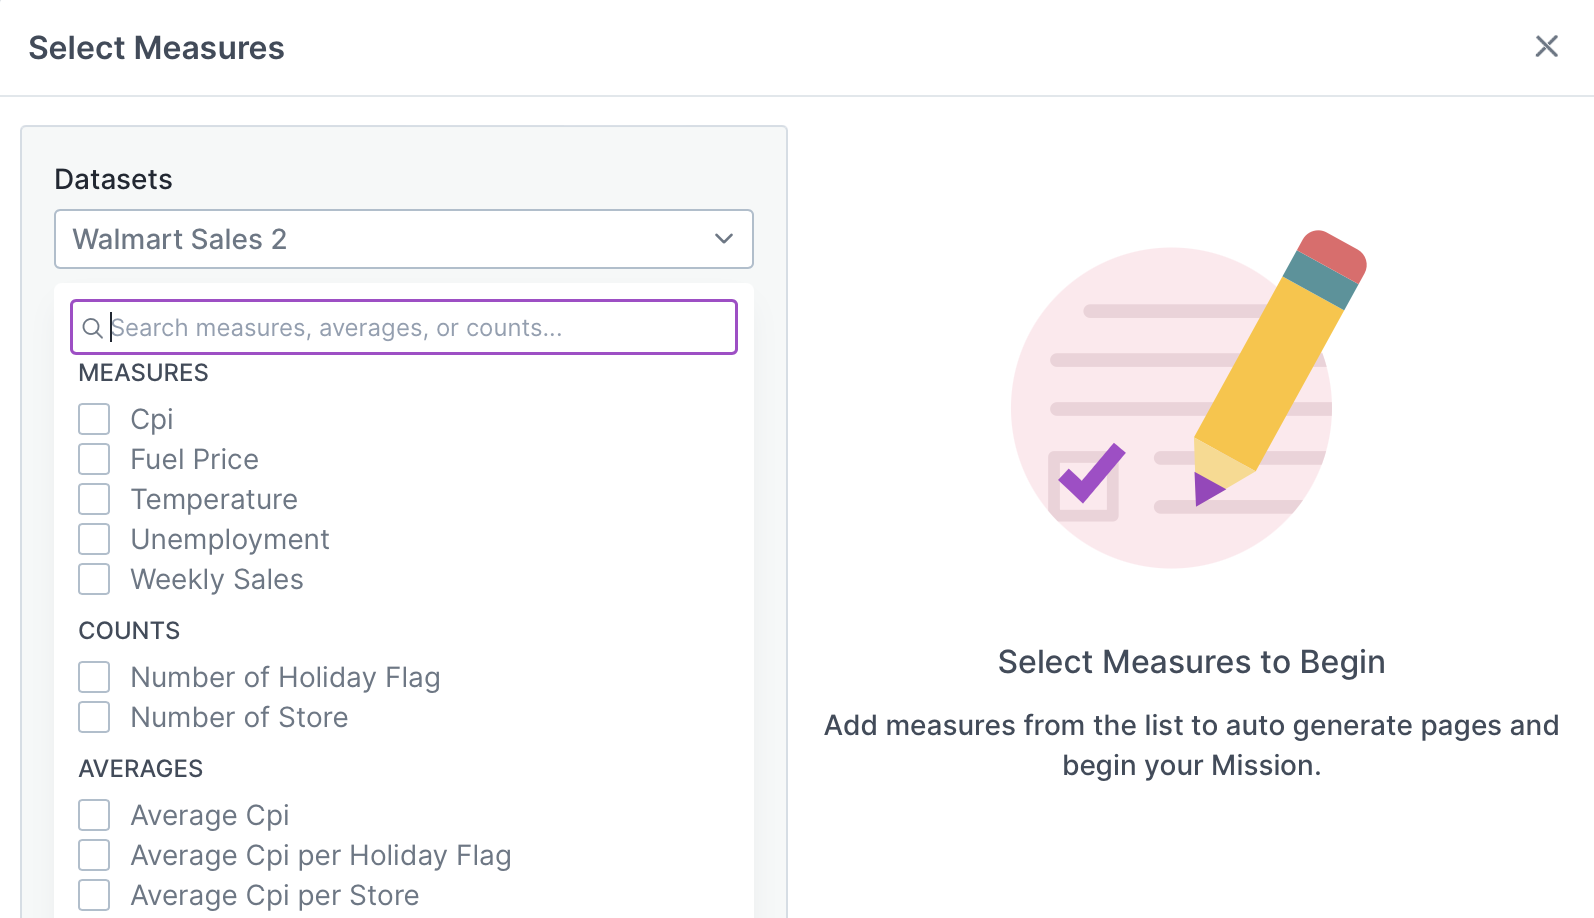
Use the New Mission option to build from scratch—select measures, counts, or averages to build your Mission. Then select Create Mission.
After you select Create Mission, Auto Insights takes you to the Mission Summary page where you'll see all of your insights!
Learn more about editing your Mission in the Edit Missions article. Note: Changes analysis is unavailable if you use a dataset without time series data.
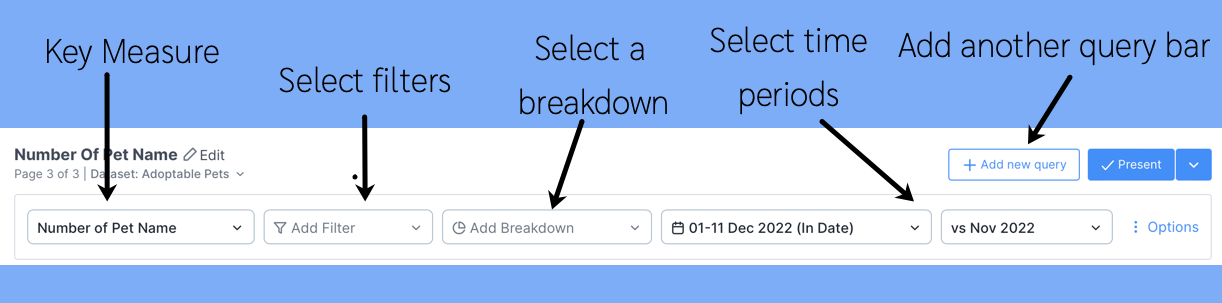
Query Bar
Each page has a query bar that provides the focus of analysis for that specific page. Use this query bar to get Auto Insights to search for insights on a specific area. Note: Time period selection is unavailable if you use a dataset without time series data.
Some questions to ask while interacting with the query bar:
Do I want Auto Insights to tell me where to focus?
I'm not sure which segment I should break down by. Things always change each month.
If this is what you need each month, let Auto Insights do the work and identify the largest contributing factors that cause the change.
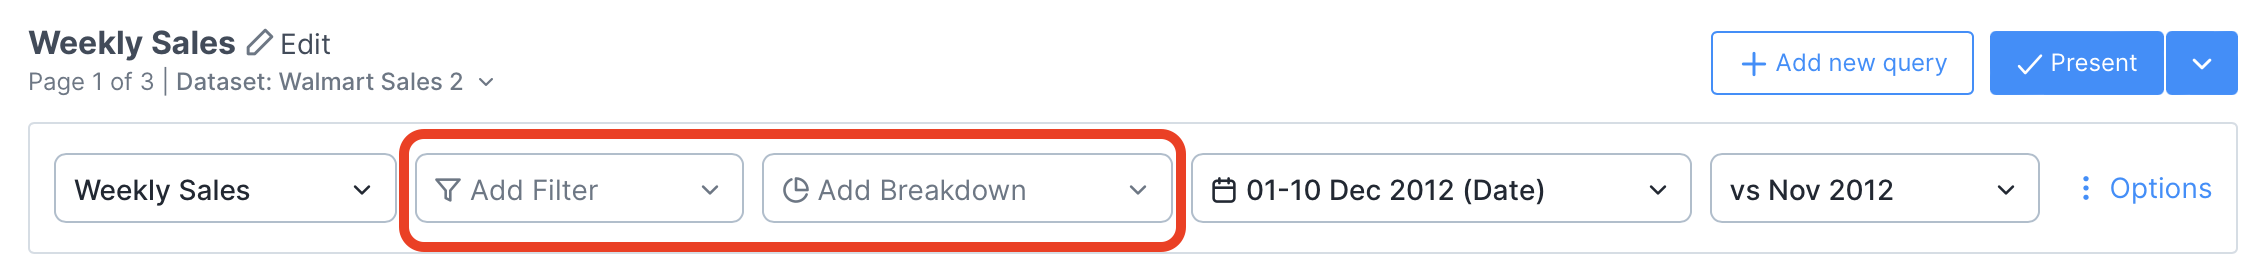
You should leave the filters and breakdowns blank in this scenario. This way, Auto Insights will calculate the largest contributing factors and display them in descending order.
OR
I know that I need to focus on a specific area...
I need to only look at my team's performance. I'm not interested in other teams.
I need to only focus on my product. I'm not interested in other products.
In this scenario, you should add filters to your query—for example, Team 6.
OR
I know that I want to compare across a segment (dimension)
I need to understand movement across all teams.
I need to know how my product is performing against other products.
In this scenario, you should add breakdowns to your query—for example, Teams.

Related Articles
See the Missions and Edit Missions pages to learn more.