Contributions Explained
Now that you are more familiar with Auto Insights, you will face insights generated on averages and ratios. This article guides you through how to understand the insights Auto Insights has called out.
Let's get the terminology out of the way first:
Averages (metric)—Automatically calculated within Auto Insights by taking the sum of a measure divided by a unique count of a segment (for example, Average Sales per Department, or Average Incidents per Category). Note—Simple average is not a part of Contributions.
Ratios (metric)—Calculated within Auto Insights by taking the sum of one metric divided by the sum of another measure (for example, Average Price (Sales/Quantity), or Completion Rate (Completed_Incidents/Incidents)).
Contributions—They show the influence of each level (in a specific segment) on the total change in the metric.
Within the What Caused This section, for averages and ratios are 3 main columns: the main metric, numerator changes, and denominator changes.
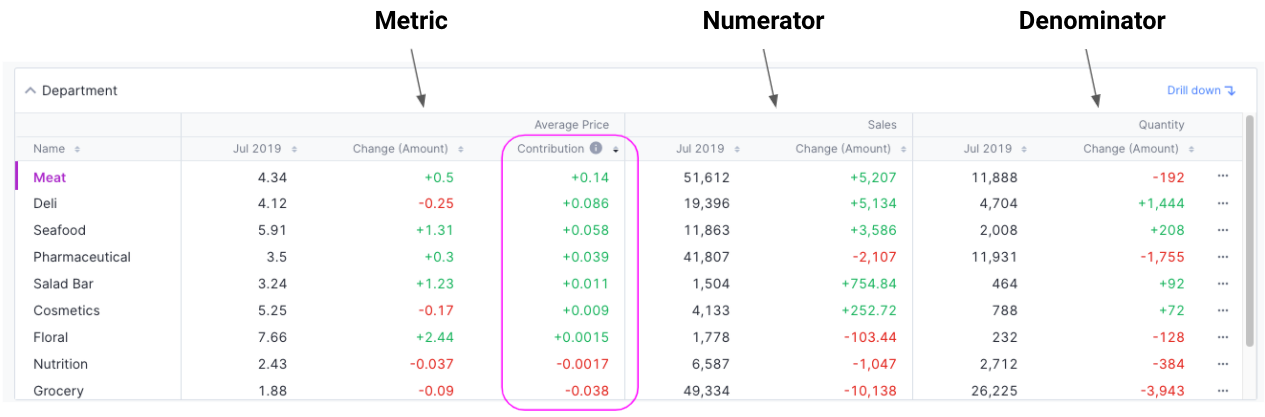
When you take the sum of contributions within each segment, it will add up to the metric trend change.
This helps you visualize for each segment level (in this case, supermarket departments), which department positively contributes to the change in sales, and which one negatively contributes to the change in sales.
Essentially contribution takes into consideration the ranking of that department compared to the others in that period vs their ranking in the previous period.
How Do I Interpret Contribution with Respect to My Metric?
Let’s take a look at this example, where we see Loyalist customers had contributed to a 0.31 increase in the overall average price for that month (0.2 increase). Promiscuous customers, on the other hand, had contributed to a 0.12 decrease in the overall average price.
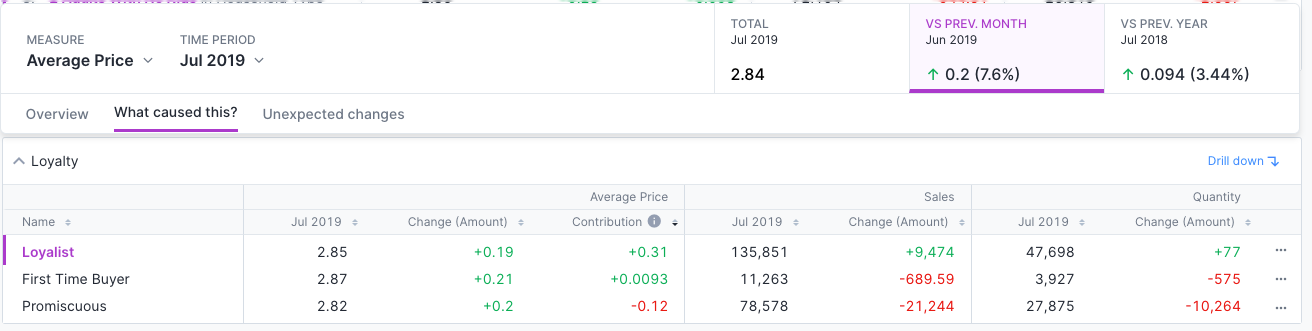
The main difference in contribution signs:
Loyalist vs Promiscuous is due to the shift in the base. So even though per item the average sales dollar had increased, overall, because of the large drop in the number of items purchased, this resulted in Promiscuous customers dropping in their average ranking compared to last month, hence a negative contribution.
Promiscuous vs First Time Buyer: It is different for First Time Buyer as there’s no change in its ranking compared to last month, thus a positive increase.
What about the Scenario Where My Metric Has Declined from Last Month but Shows a Positive Contribution?
Take the Deli Department in the earlier screenshot as an example, month on month, the average price had declined by 0.25, but it still has a positive contribution.
Essentially, this dip in Deli's average price caused the proportion (ranking) of Deli sales to increase in the latest month compared to last month, Thus, the decline in the deli's average price had a positive contribution to the increase in sales, pushing up the average price across all departments.
Can You Prove the Contribution Calculation?

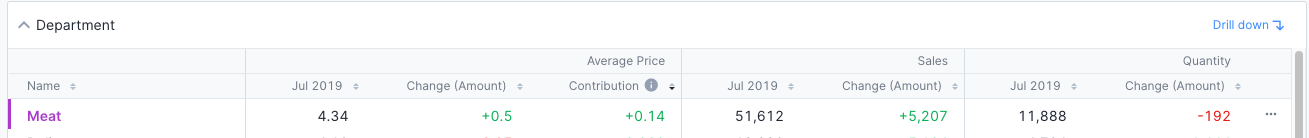
Let's calculate the contribution number for the meat department in this example (total quantity in Jul was 79500 with a -10,762 change from last month):
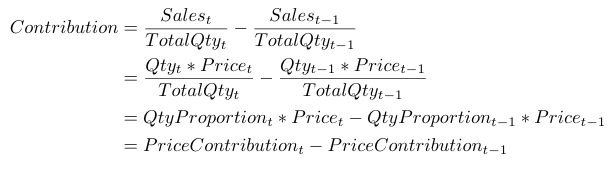
Meat contribution =