Data Preparation
So you're ready to get started uploading data to Auto Insights? Great! Before doing so, run through the checklist to make sure your data meets our recommendations and requirements.
What data does Auto Insights work best on?
Structured data
At least a couple of key measures
Rich dimensions to explore
Transactional/ Time Series Data. You can use a dataset without time series data, but time comparisons and changes features are unavailable.
Looking at patterns or trends over time
What data does Auto Insights not work on?
Unstructured data–Auto Insights does not perform sentiment analysis therefore anything that has a free text field will need to be grouped or excluded
Geographical visualization–maps (longitude, latitude)
Auto Insights does not do predictive modeling or forecasting–predictive modeling requires business acumen knowledge, judgment, and overlays; However, if you have your own forecast scores, you can upload that into Auto Insights to trend and analyze.
Auto Insights is not an ETL tool–you can't merge different table views across different data sources. However, Missions enable you to bring in KPIs across all data sources to track their progress.
Note: If you have a database connection, you can create your own custom SQL to merge tables into a single view.
What's a good use case?
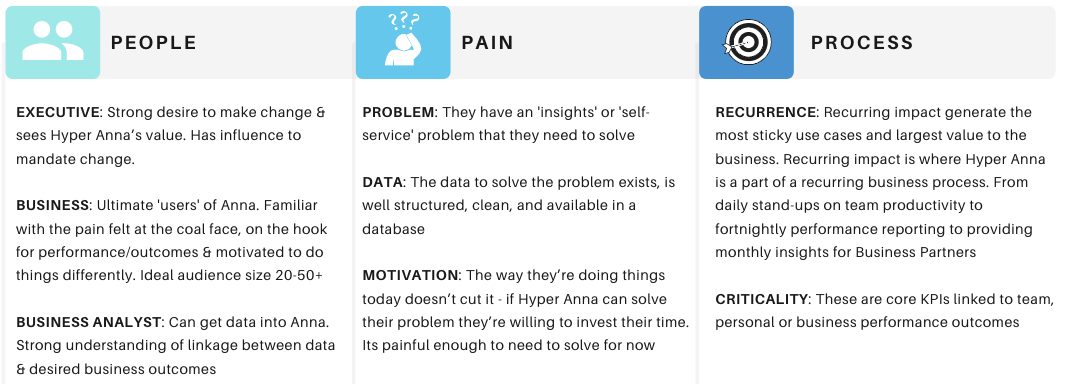
A good use case is one that solves a particular business problem. To get to a solid use case that will be able to deliver the impact that you wish, there are 3 main questions that need to be validated:
Do we have the right people involved in this initiative?
Do we have a pain point to solve for business?
Do we have a process that we can implement to ensure the impact is delivered?
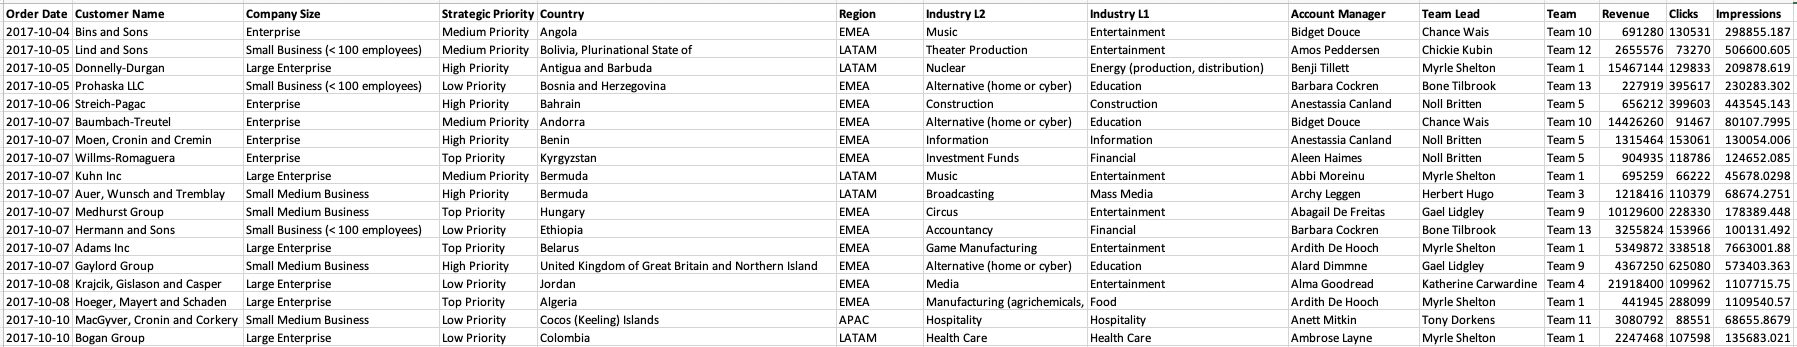
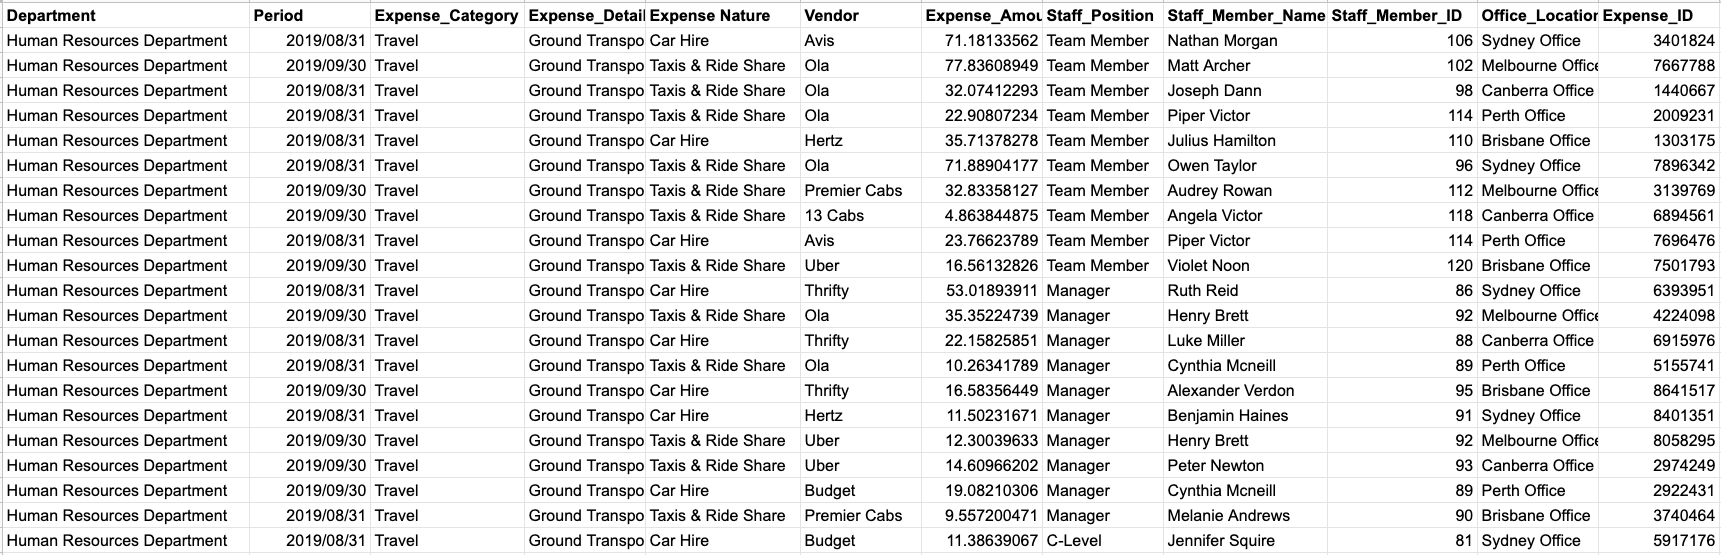
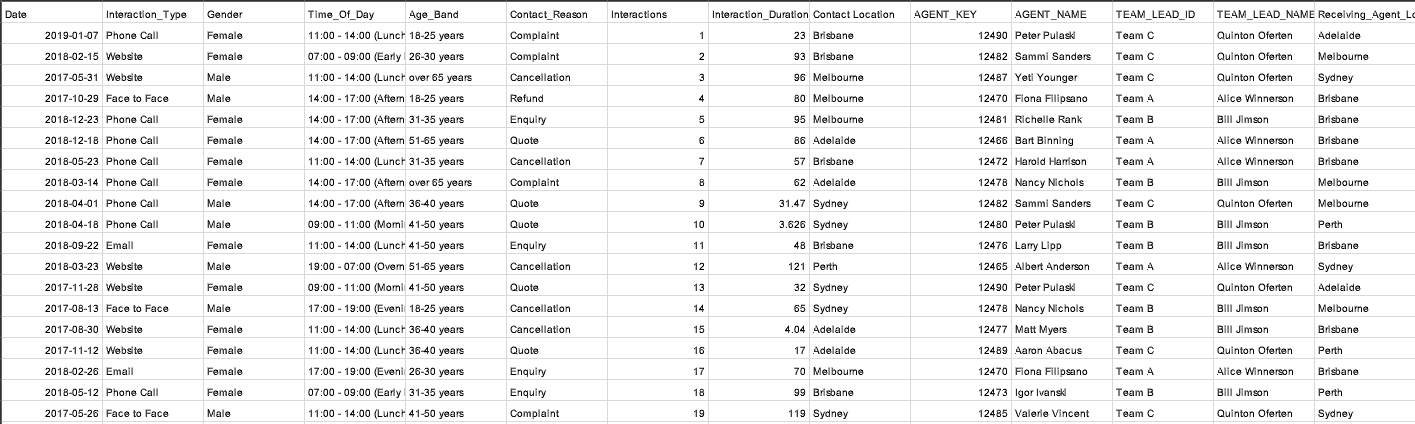
Below are some examples of typical use cases with the problem statement, how data should be structured, and the questions that can be answered.
right-click and 'open image in new tab' to expand the view.
Sales Performance
Expense & Cost Management
Support & Service - Contact Centre
What's not an ideal use case?
One that is a data dump of every type of data that a business has. There's no specific problem that this type of dataset can solve, and it makes it confusing for businesses to understand every single data column (especially if there are similar columns i.e. Department Aggregated, Source System Department) and try to make sense of which column is best for their analysis.
For every use case you will need to think about:
Data availability–Is there currently data available to perform this type of analysis
Data source–Do you know where the data is stored? Is it in one location? Does it require the merging of tables beforehand to get it into a single view for Auto Insights?
Data quality–Is the data clean and in a shape that is ready for direct analysis
Data transformation–In the second part of this article, we will go through steps to make your data “Auto Insights ready” and some data aggregation tips.
Data Preparation Checklist
The requirements and recommendations in the checklist below are applicable to both data upload methods.
Requirements | |
General | ✓ No free text or unstructured data columns (for example, comments or messages). |
Column Headings | ✓ Column names are included as the first row of data. ✓ Must not include the pipe “|” character. ✓ Have no more than 128 characters. ✓ No duplicate column names. |
Data Attributes | ✓ At least one measure field, with thousands separators, special characters (%) (#) (\), and currency indicators removed. ✓ At least one segment. ✓ Columns with more than 256 characters in a single cell will get truncated. ✓ Segment values can contain any characters supported by Unicode/UTF-8 encoding. |
Tips and Tricks
We've outlined below a few of our tips and tricks that you can use to take your data from good to great.
While the examples are shown in a CSV file, these tricks also apply if you are connecting Auto Insights to your database.
With Dates:
How to quickly re-format a date
If you have 2 date columns (for example, Start Date, End Date) that you would like to analyze time taken, we recommend creating a duration column and setting it as a segment.
Auto Insights provides FY analysis automatically, you will need to define the start of the FY month in Step 5 of the data upload process; there's no need to have a separate date column to calculate FY time granularity.
With Measures
Auto Insights will automatically provide a distinct count of every segment; If you have an Employee ID, we are able to provide a calculated field 'Number of Employee ID' so that you don't need to provide another column 'Count of Employee'.
Auto Insights will automatically aggregate measures and counts based on available time granularity in your data, i.e. if your data is at a daily level, we are able to provide a weekly granularity, monthly granularity, or yearly granularity automatically*, there's no need to have separate measure columns for each granularity.
Averages - Auto Insights will automatically calculate averages between a measure and a segment
Measure = Sales, Segment = Department
Average = Averages Sales per Department.
There's no need to manually calculate averages in your data file.
* If your data is started at monthly granularity, Auto Insights will not be able to provide daily/weekly granularity.
With Segments
If your data has coded values (Is Active Flag = 1/0), we recommend changing the data to natural language for businesses to understand (for example, Is Active, Is Not Active).
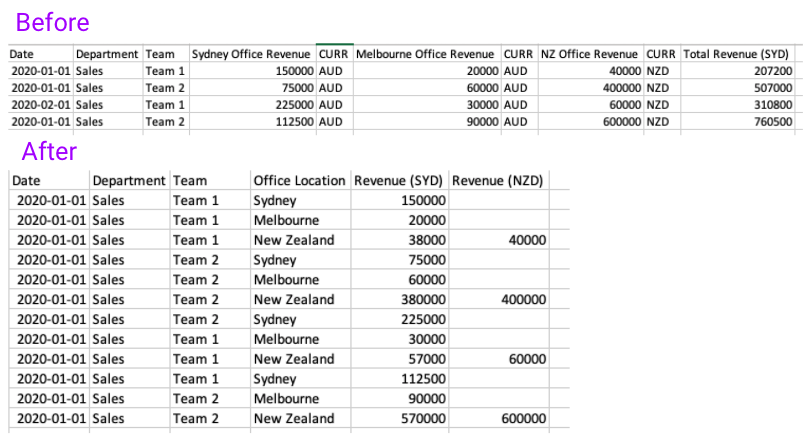
If your data is in the following format, we recommend transposing the data so that the data is combined into a single segment column (for example, Office Location), instead of splitting it up into multiple measure columns (for example, Sydney Office Revenue, Melbourne Office Revenue, NZ Office Revenue)
Now, your data is Auto Insights ready!