Edit Missions
Customize Mission Summary Layout
This article describes the many ways to edit your Missions. If you have edit permission on a Mission, you have 2 options to enter edit mode:
Open the Mission you want to edit and select Edit Mission in the top right corner.
From the Mission Summary page, select Options > Enter edit mode.
Auto Insights provides flexibility and customization options for presenting your data and key performance indicators (KPIs). One way to do this is through Mission Summary layouts.
Choose between 3 layouts for your Mission Summary:
· Full Insights—ideal for a detailed analysis of data.
· Visualization—prioritizes visual elements for a more engaging presentation.
· Minimalistic—streamlined, focused, and perfect for highlighting key metrics in a concise view.
To change the layout for 1 page of your Summary...
Enter Edit mode.
Select Customize in the upper-right corner of the page card, then select Change layout.
The Change layout window displays. Select Full insights, Visualization, or Minimalistic layout.
Select Apply. The page layout updates instantly.
To change the layout of multiple pages of your Summary at once...
Enter Edit mode.
Go to the list of pages in the left sidebar.
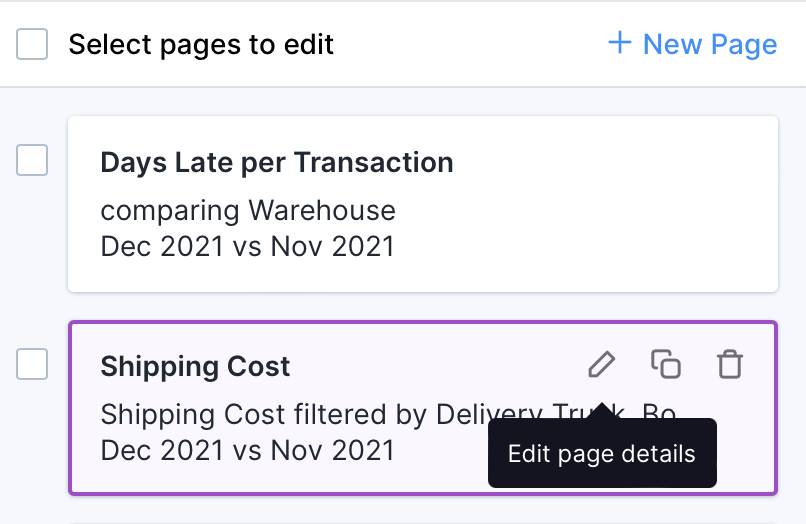
Check the box next to each page you want to edit.
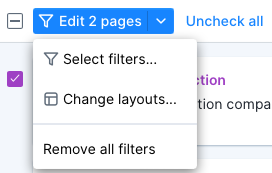
Select the Edit pages dropdown at the top of the list, then select Change layouts...
The Change layout window displays. Select Full insights, Visualization, or Minimalistic layout.
Select Apply. The page layouts update instantly.
Edit Page Title
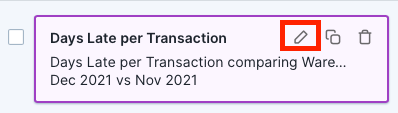
To edit a page title, select the Pencil icon next to the title on a Summary page or from the page list.
Add Author Notes
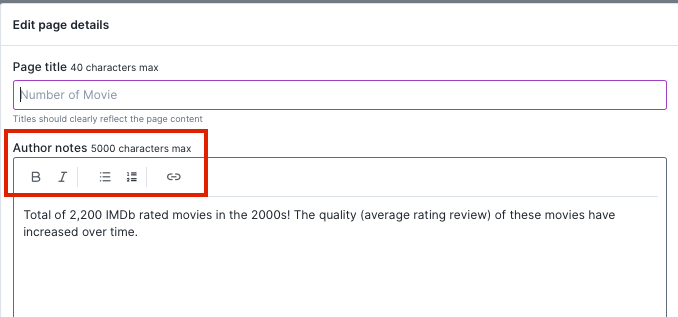
As the Mission creator or editor, you can update the title and add a commentary on each page of the Mission. To do so, select a page, then select the Pencil icon.
 |
Enter your preferred title for the page and any additional commentary to explain or highlight context for the viewer in the Author notes. You can view Author notes in the Mission summary, Mission pages, and subscribed email from a Mission.
 |
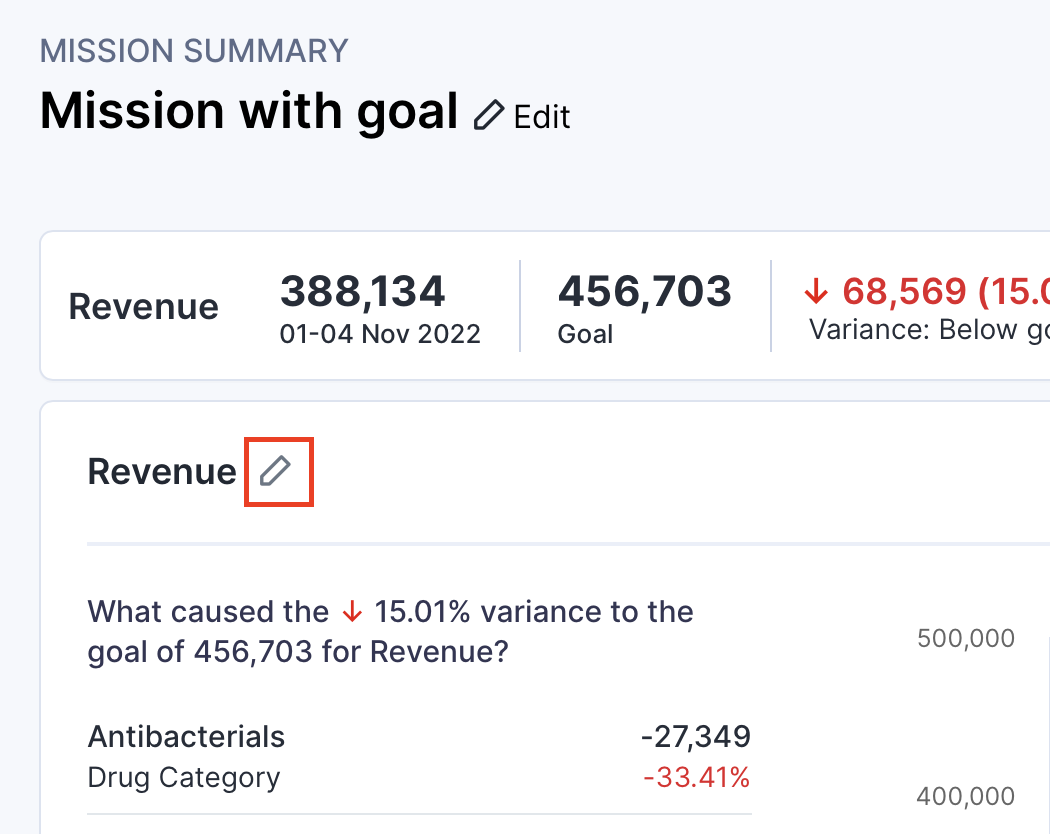
You can also add Author Notes on the Mission Summary page. To do so, select Edit for the Mission, then select the pencil icon next to the card title.
 |
Add Pages to Your Mission
There are 4 ways you can add a page within Mission:
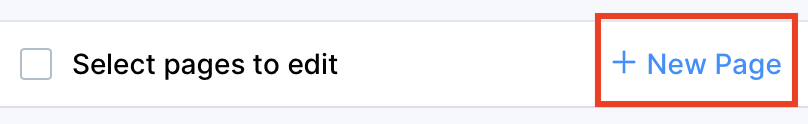
First Option: Within Mission's edit mode, select + New Page on the left panel.
 |
Second Option: Select Edit Mission > Options > Duplicate.
Tip: Use this method to keep the existing filters and breakdown from the 1st page in subsequent pages (it only works when the dataset remains the same). This saves you time and reduces effort on repetitive tasks!
Third Option: If you see a page in someone's Mission that you want to add to your own Mission, select Options > Add Page to Mission and create a new Mission or select an existing one.
Fourth Option: Select Add page to Mission from a Search page.
Reorder Pages
To reorder the pages, select the page that you want to reorder and drag the page to a new position.
Hide Insights That Don’t Matter
You can remove any story card (section) within the page you want to hide from the presentation view. To do so, select the eye icon to turn it off. When you hide a story on the page level, Auto Insights does not display it at all on the Mission summary. However, Auto Insights might still call out this story on the chart and highlight it.
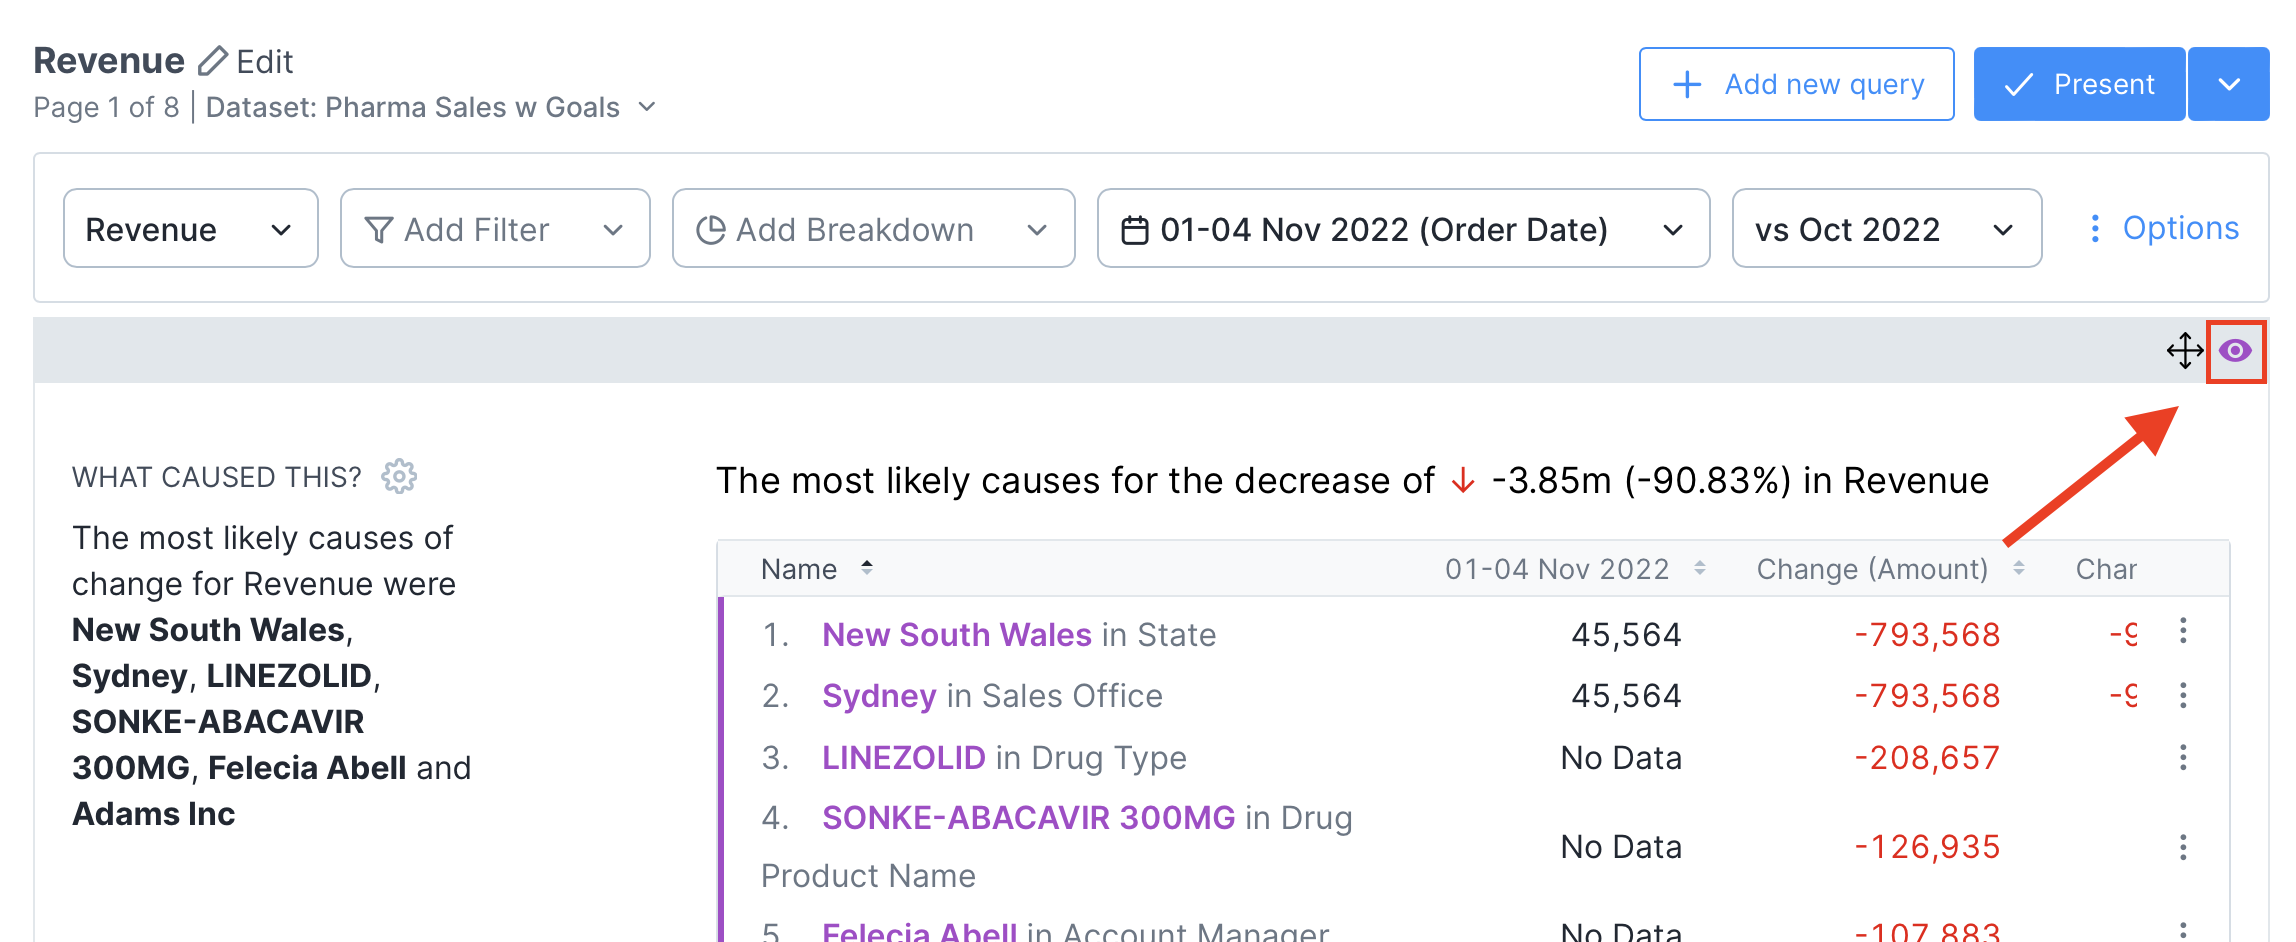 |
The card appears dimmed. Select the eye icon again to turn it back on.
Find New Insights with the Query Bar
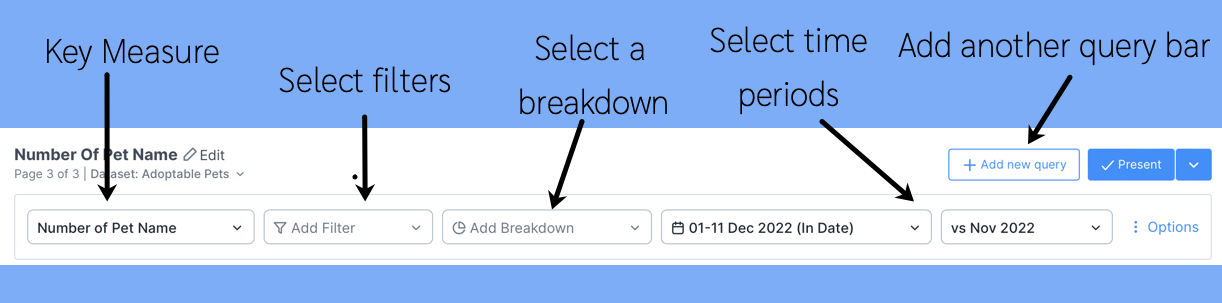
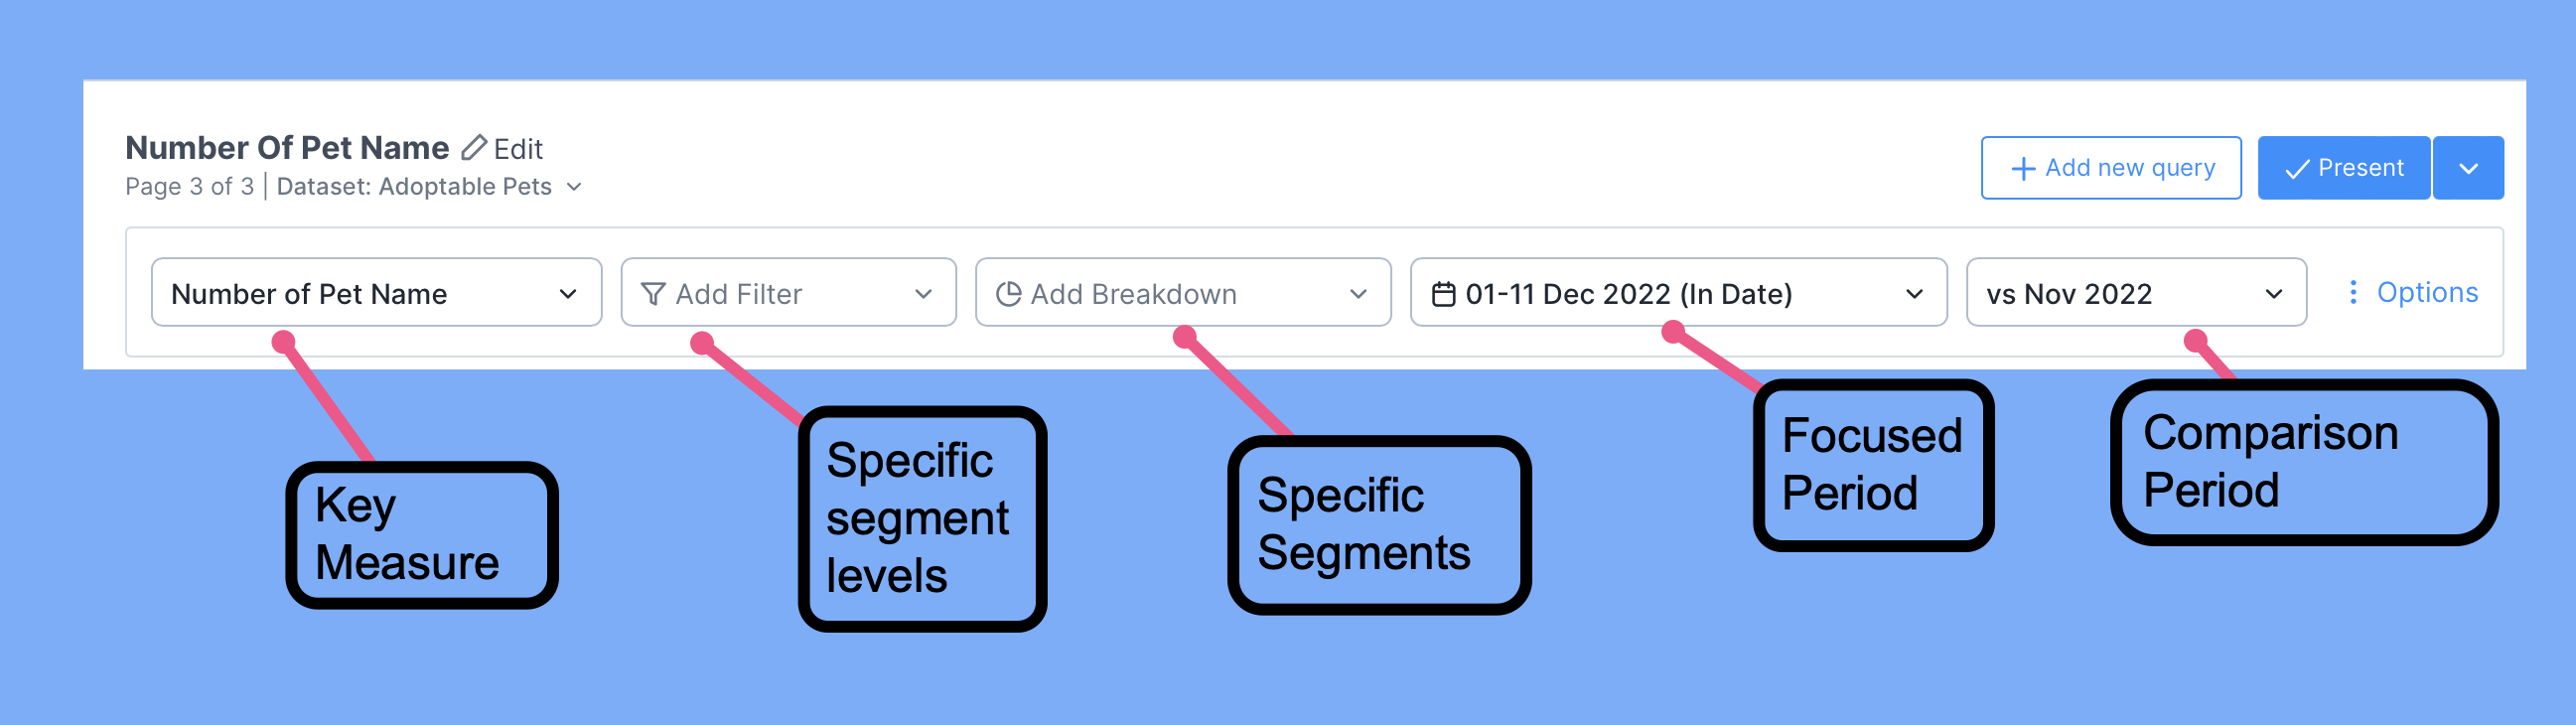
Each page has a query bar that provides the focus of analysis for that specific page. Use this query bar to get Auto Insights to search for insights on a specific area.
 |
You can change the comparison period to compare against the previous month or the same month last year. Refer to this article on Time Comparison for details. Note: Time period selection is unavailable if you use a dataset without time series data.
 |
Select +Add new query to compare 2 metrics with Common Cause Analysis. Select Options to remove a query or rename a query.

Customize Segment Relevancy
You can customize results for What caused this change? To do so, select Customize > Specify relevant segments on a Mission Summary card or the settings icon on a Mission page. If you're the owner of the dataset, the Customize segment relevancy window displays for you to customize.
If you're not the owner of the dataset, Auto Insights shows you the owners' email addresses. Ask an owner for access to customize the segment relevancy.
Note
This functionality isn't available for sample datasets.
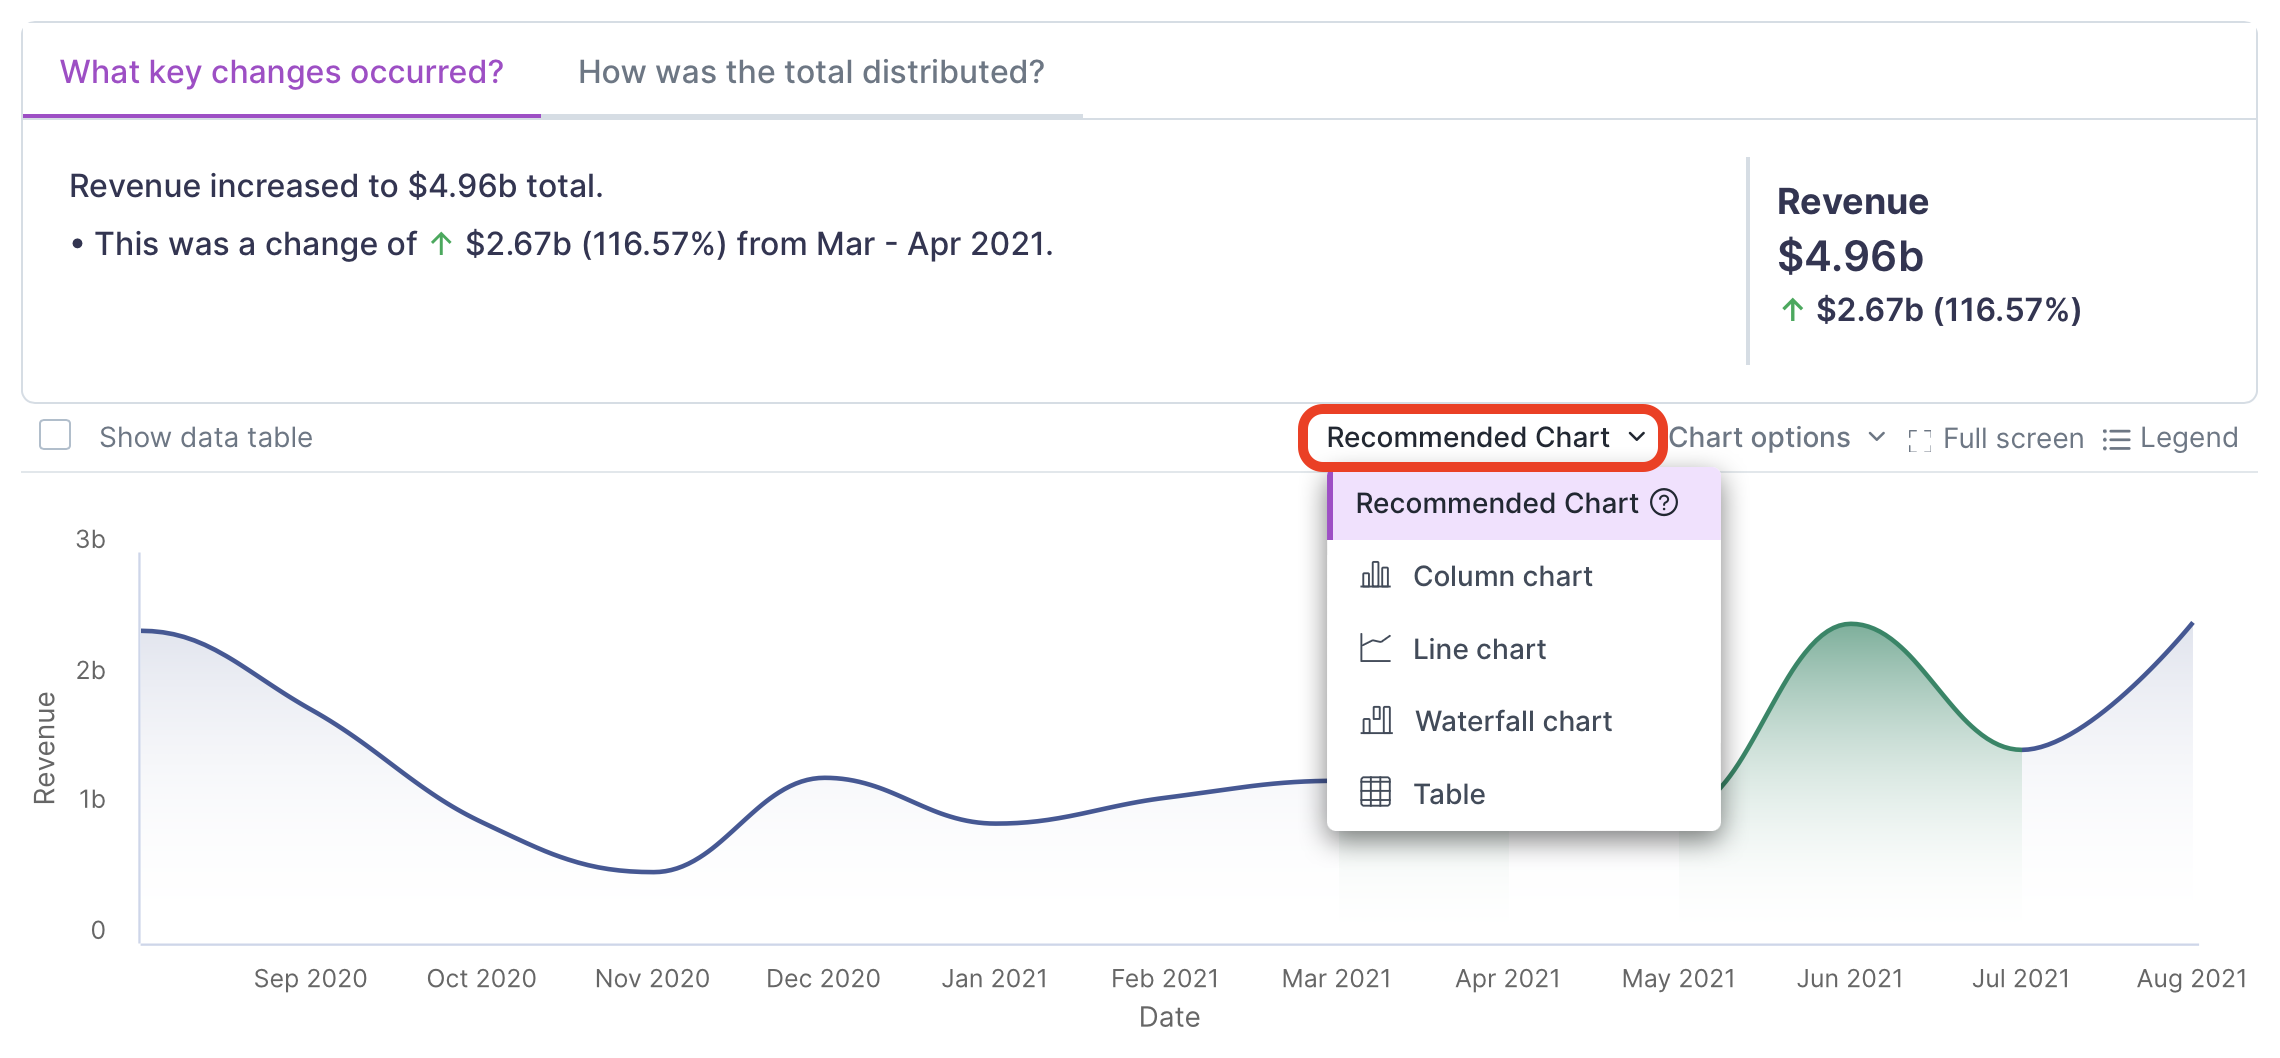
Recommended Charts
Auto Insights uses Recommended Charts to connect the best charts with the insights shown. To make the recommendation, Auto Insights looks at whether the insights are about TOTAL, CHANGE, or GOALS, the size of the segment, or if you are looking at a breakdown versus an overall metric. The goal is to help you create the most effective and informative chart possible with minimal effort.
To display a chart other than the recommended chart, select the Recommended Chart dropdown. Then select a new chart type. The chart type you choose displays. It also displays on the Mission Summary.
 |
To go back to the recommended chart, select the chart dropdown, then select Recommended Chart.
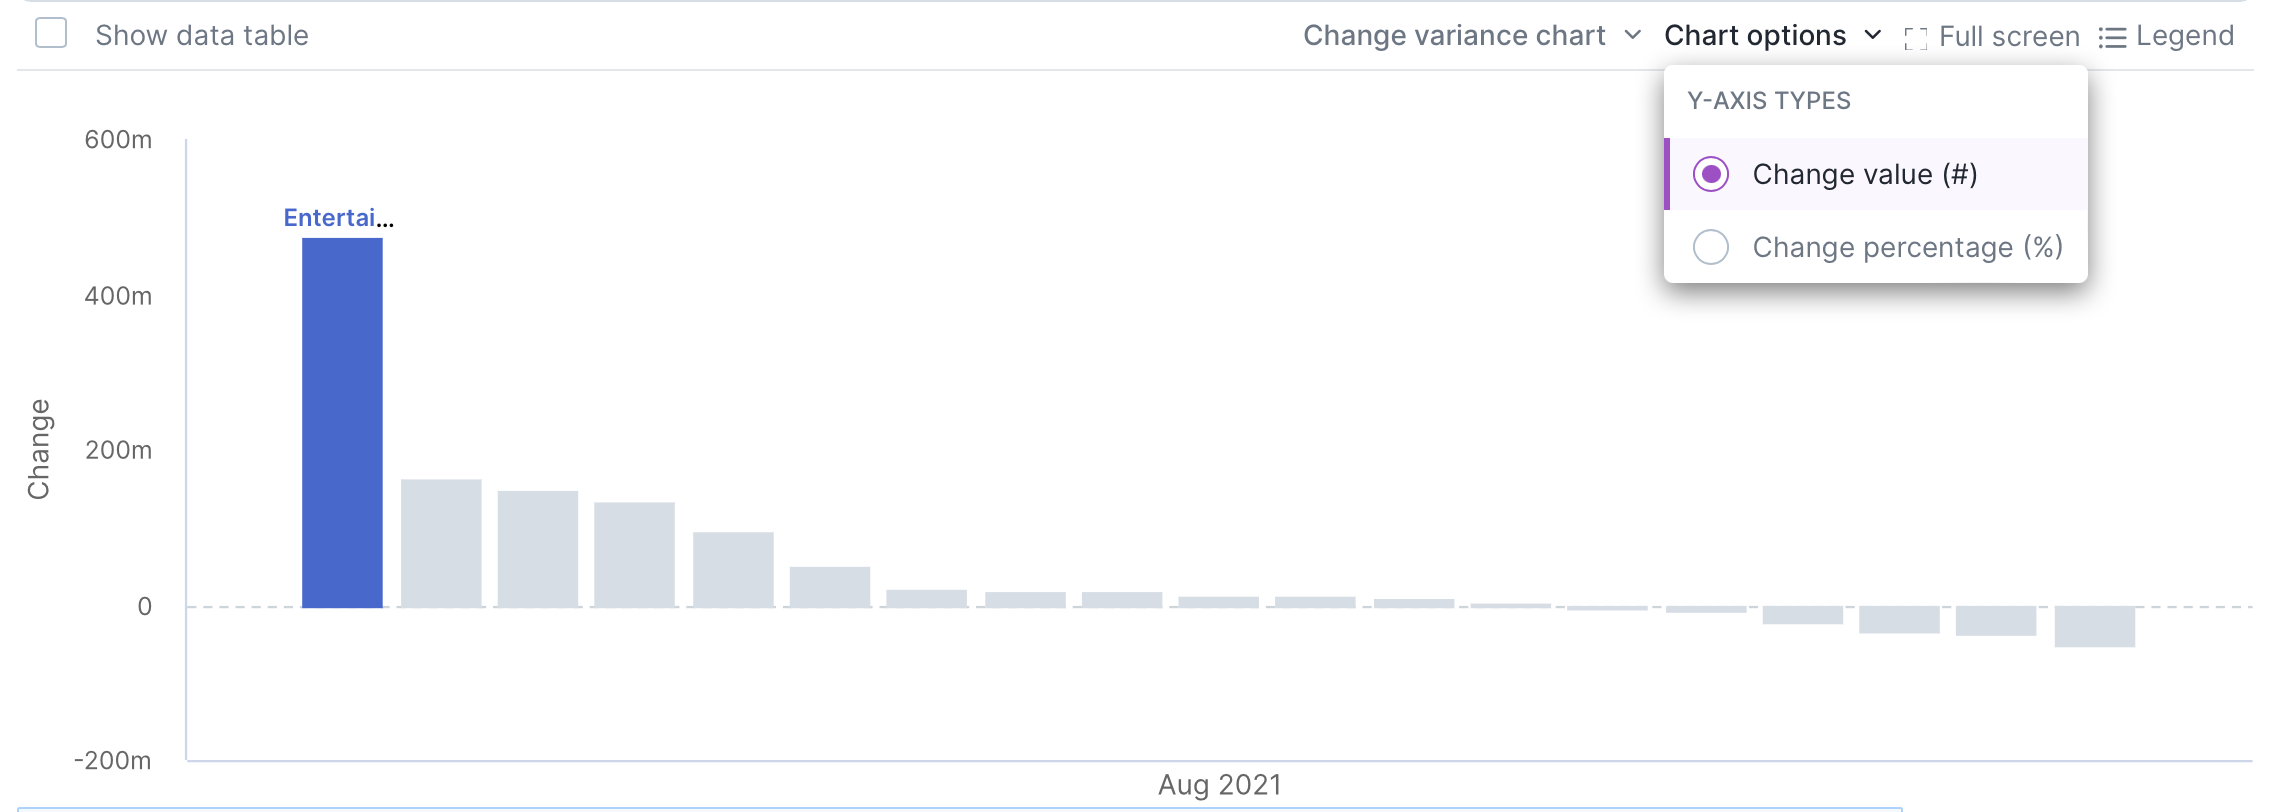
Chart Toolbar and Options
The chart options allow you to make further adjustments to a few charts and enable you to include a totals table (leaderboard table) to appear in the Insights email. Note that charts don't appear in the Insights email.
Charts with options include:
Change Variance chart—Select to show Change value or Change percentage on the y-axis.
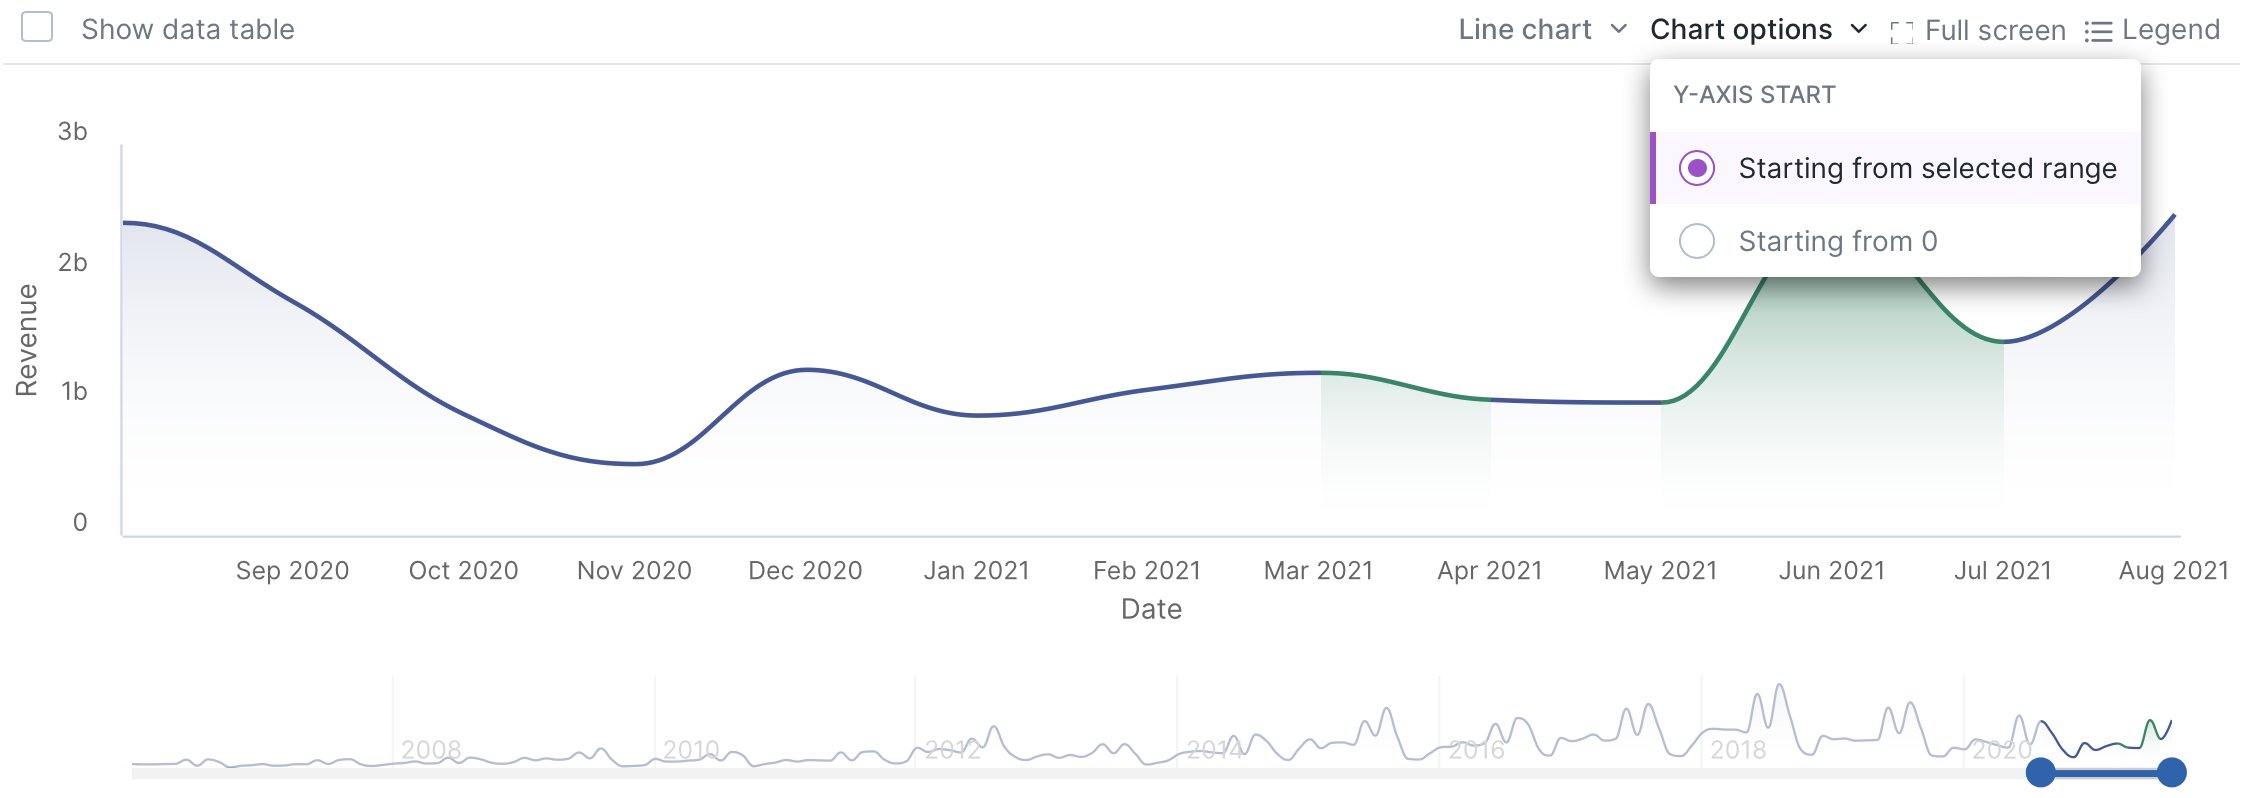
Line chart—Select to have the y-axis start from the selected range or from 0.
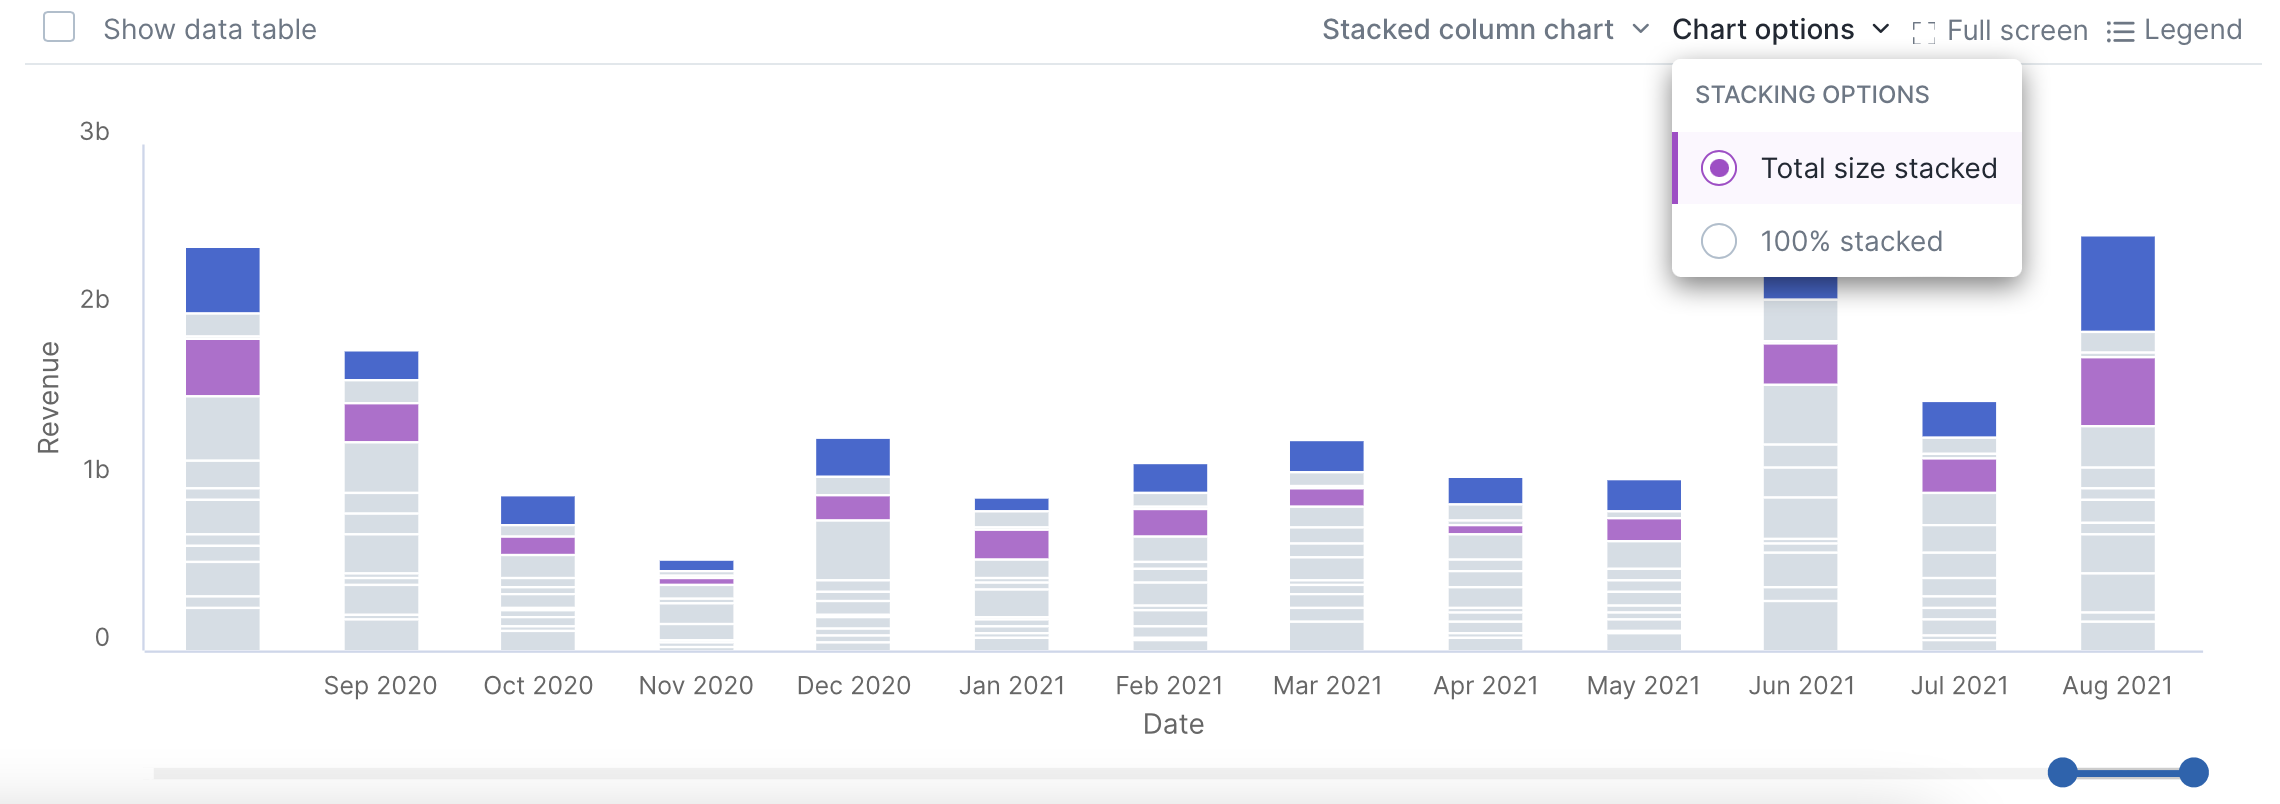
Stacked column chart—Select to have the Total size stacked or 100% stacked.
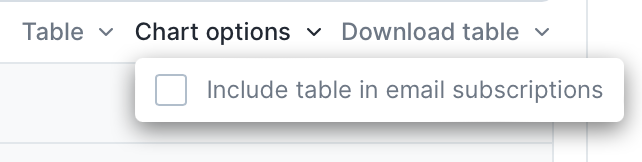
To include a totals table in your Mission's Insight email, select Chart options, then check the box for Include table in email subcriptions. Note that this option is only available for table charts when you're on the How was the total distributed? tab.
 |
Delete a Page
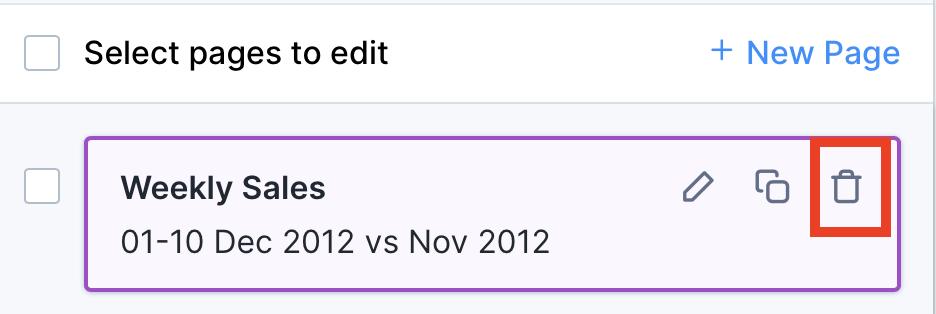
To delete a page from your Mission, select the trash can icon.
 |
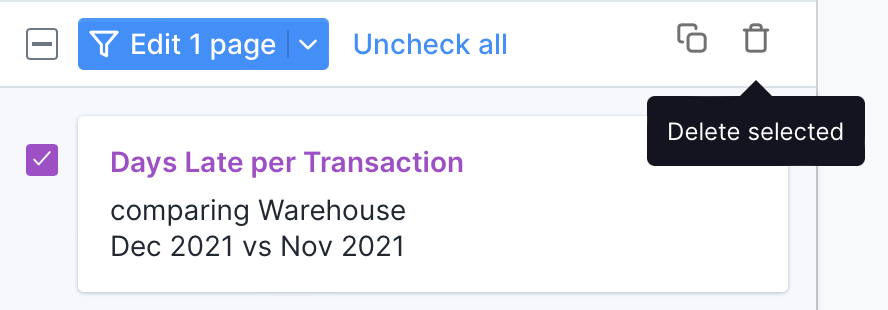
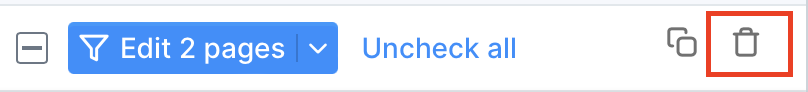
To delete multiple pages, check the box to select the pages. Then select the trash can icon to delete them. Note that a page deletion is irreversible.
 |
To delete a page from the Mission Summary, select Edit Mission, then select Options > Delete on the story card.
Use Global Filters and Bulk Actions
With global filters, you can bulk edit and delete Mission pages. To use global filters...
Go to Missions and select a Mission.
Select Edit Mission in the upper-right corner.
Check the box next to a page to select it, and a bulk action menu displays at the top of the list. You can only bulk-select pages associated with datasets you can access.
Available Bulk Actions | ||
|---|---|---|
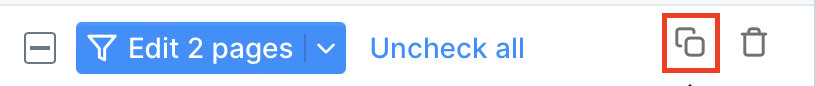
Duplicate |
| |
Delete |
| |
Filter—Apply and remove filters on pages that use the same dataset. Change layouts—Select a Mission Summary page layout option to apply to all checked pages. |
| |
Delete pages associated with a deleted dataset. | To do so, select Remove pages from the alert message. | |
Present Your Mission
Select Exit edit mode to go back to the presentation view.