Quick Guide to Find and Create Insights
Welcome to Auto Insights. To help you get started, check out the video below for a quick tour.
Upload Data in Auto Insights
You must be an admin to upload datasets. You can upload datasets in Designer with the Auto Insights Uploader Tool or directly in Auto Insights via database connection or CSV file upload.
Dataset Requirements
At least 1 segment column (formatted as string/text).
Remove free text or unstructured data columns (data longer than 256 characters will be truncated)
Segment values (string data) can now contain any characters supported by Unicode/UTF-8 encoding.
Column names must...
Have no duplicates.
Be included as the first row of data.
Not contain the pipe “|” character.
Have no more than 128 characters.
Recommendations
In addition to the requirements, we recommend you use a dataset with:
At least 1 number column.
Data spanning at least 24 months.
At least 5 segment columns (formatted as string/text).
The recommendations are just suggestions. You can still use Auto Insights successfully if your data doesn't have these attributes.
For more information on how to prepare and upload your data, see Data Preparation and Upload Dataset articles.
Missions
The Missions page is the best place to find and create in-depth insights about any areas within your dataset.

On your Missions Home Screen, you can view all the Missions you have access to. Search a Mission by name or filter the list of Missions by datasets used in the Mission.
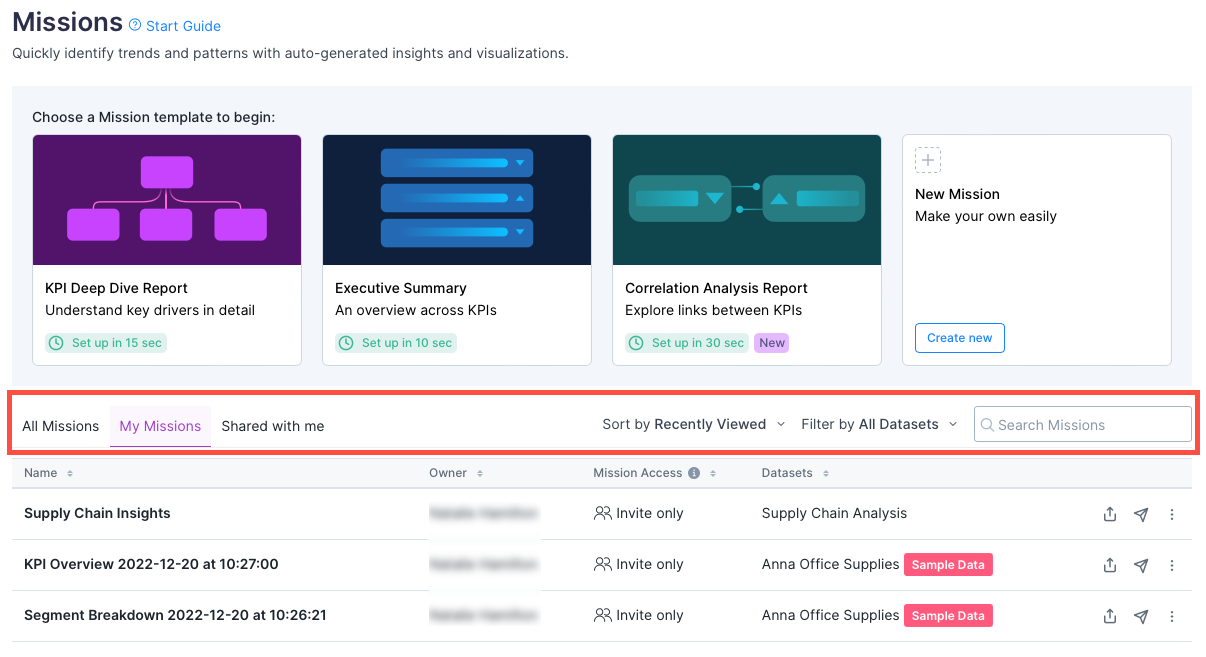
Also, you can save, collaborate, and subscribe to monitor these on an ongoing basis.
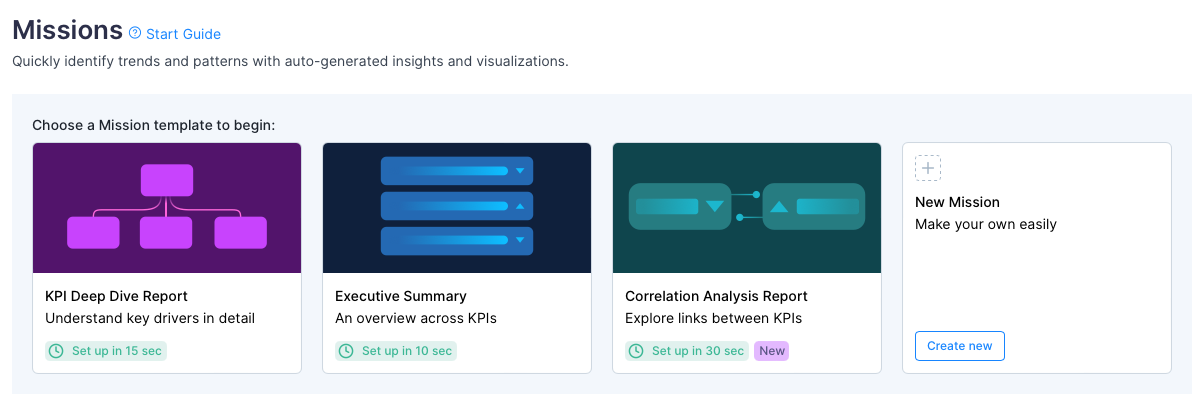
Create a Mission
To create a Mission, go to the Missions page.
Select 1 of the template options: KPI Deep Dive Report, Executive Summary, Correlation Analysis, or New Mission. See the Create Missions article for more details.
Add, Edit, and Delete Pages in Mission in Edit Mode
To enter edit mode, select Edit.
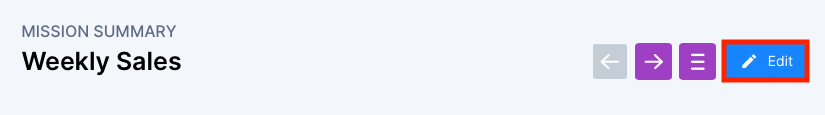
Here you can add, duplicate, edit, and remove pages. See the Edit Missions article for more details.
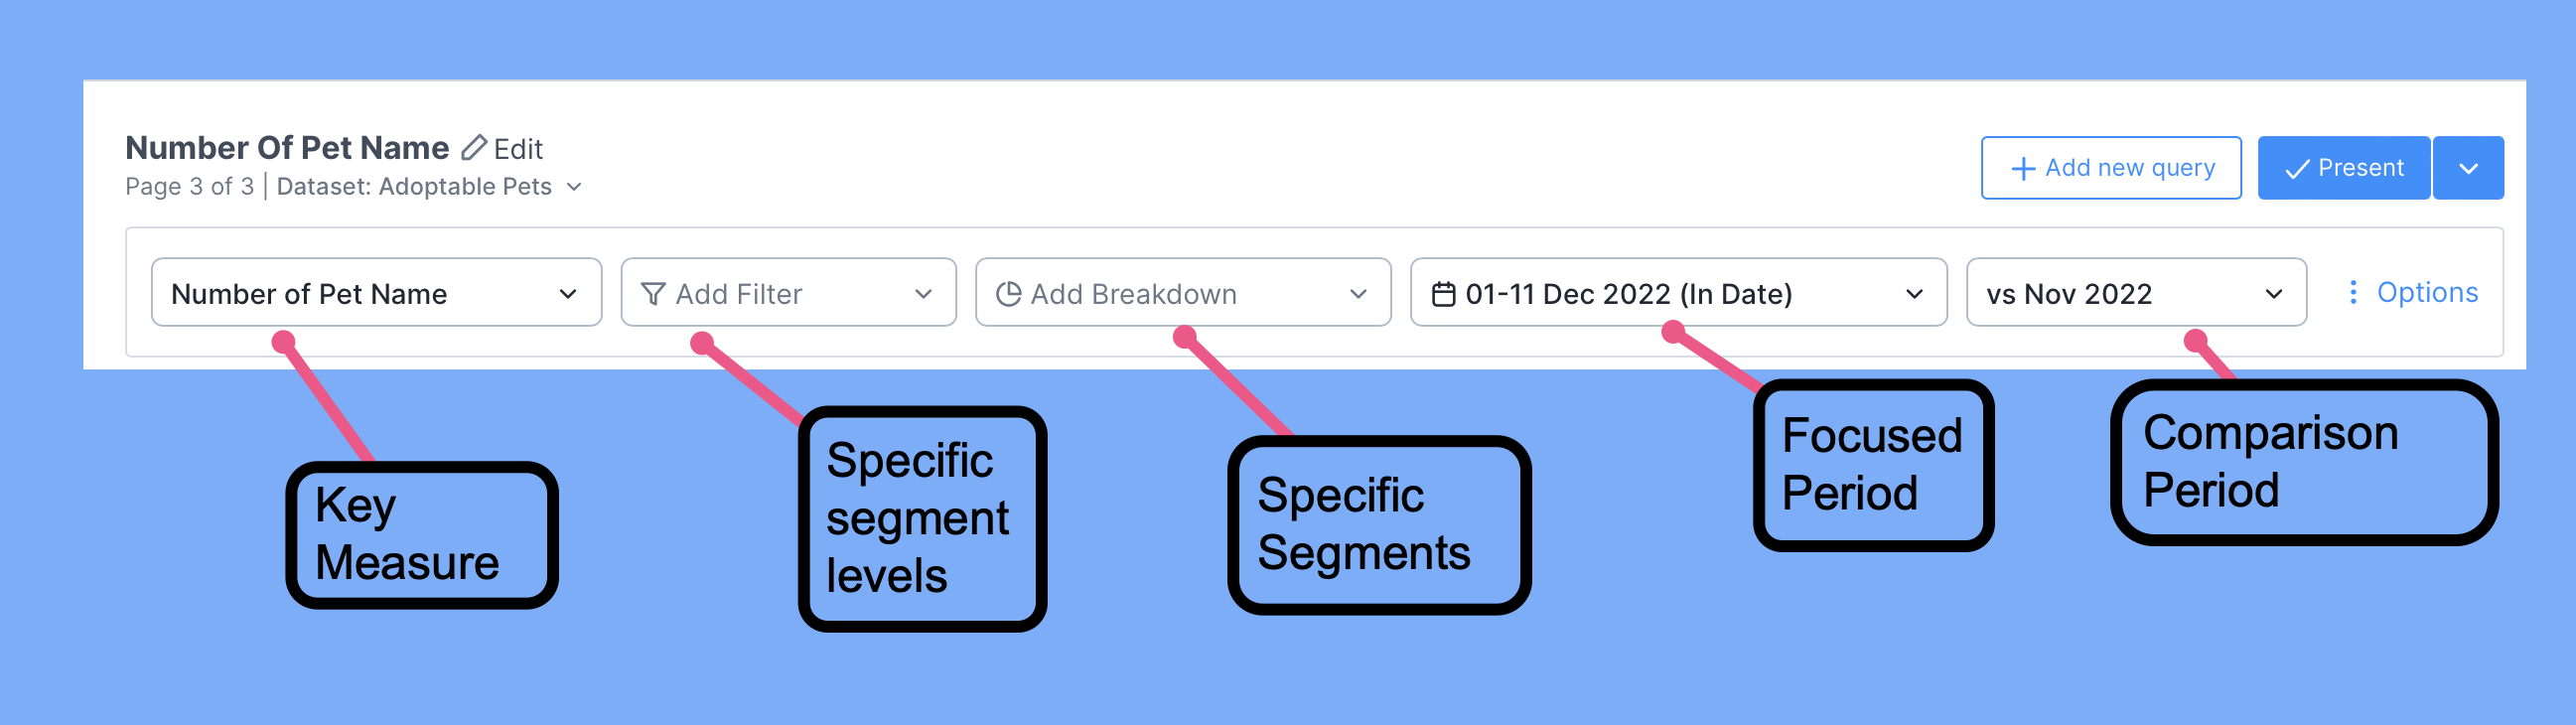
Query Bar
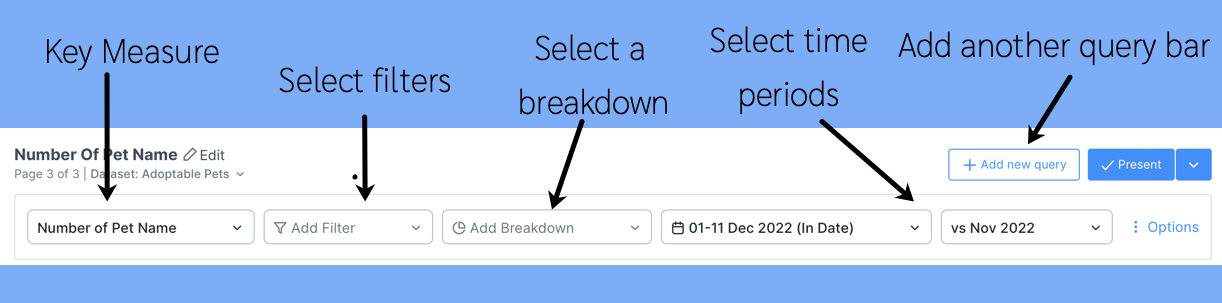
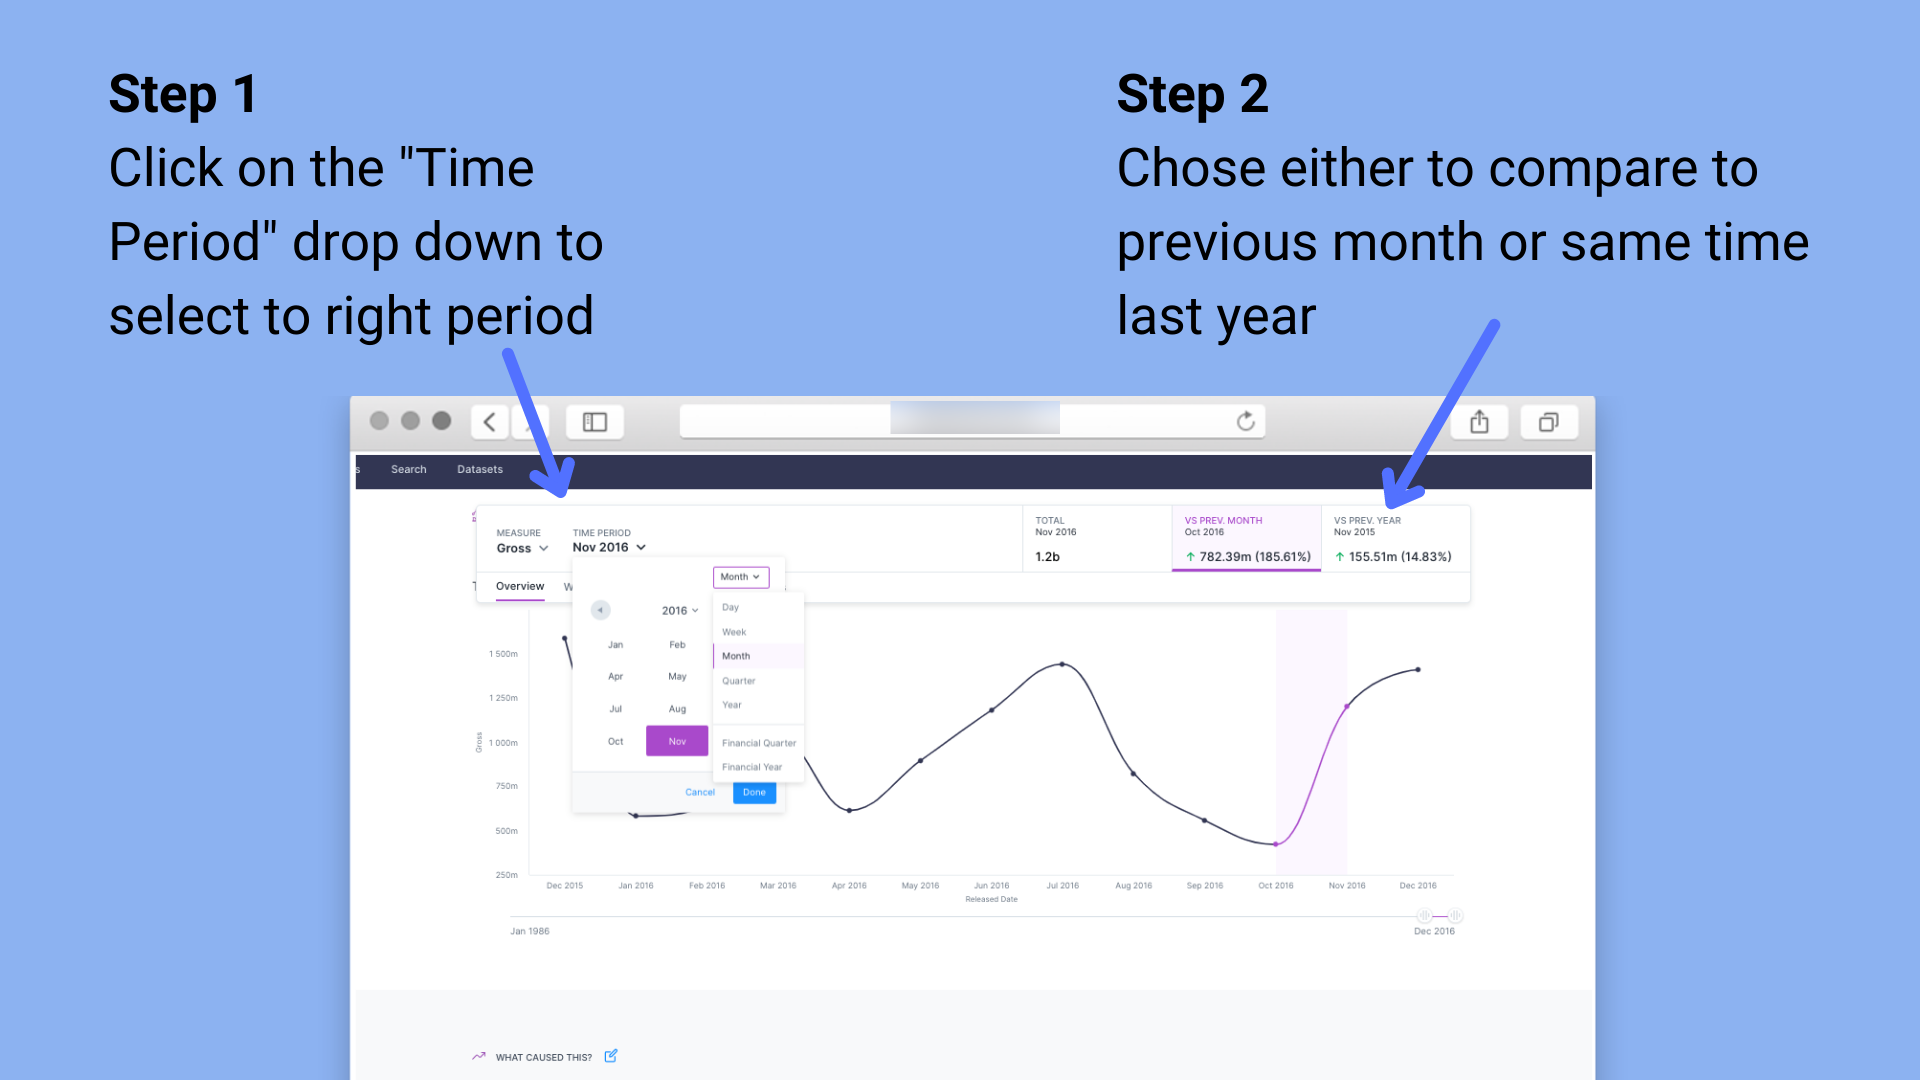
You can change the comparison period to compare against the previous month or the same month last year. Refer to this article on Time Period comparison for details.
Want to know how to make an impact with your first mission?
We have a separate article that covers how to create a best-in-class Mission report guide as a start.
Trend Over Time
Scroll down or select Overview. Auto Insights highlights the latest month-on-month change in purple. Drag the time scale slider underneath the graph to see the trend over a longer period to identify peaks and troughs.
Changing Dates
Our standard default week commences on a Sunday. If that’s not how your organization's reporting is, you have the flexibility to amend it. Read here for more information.
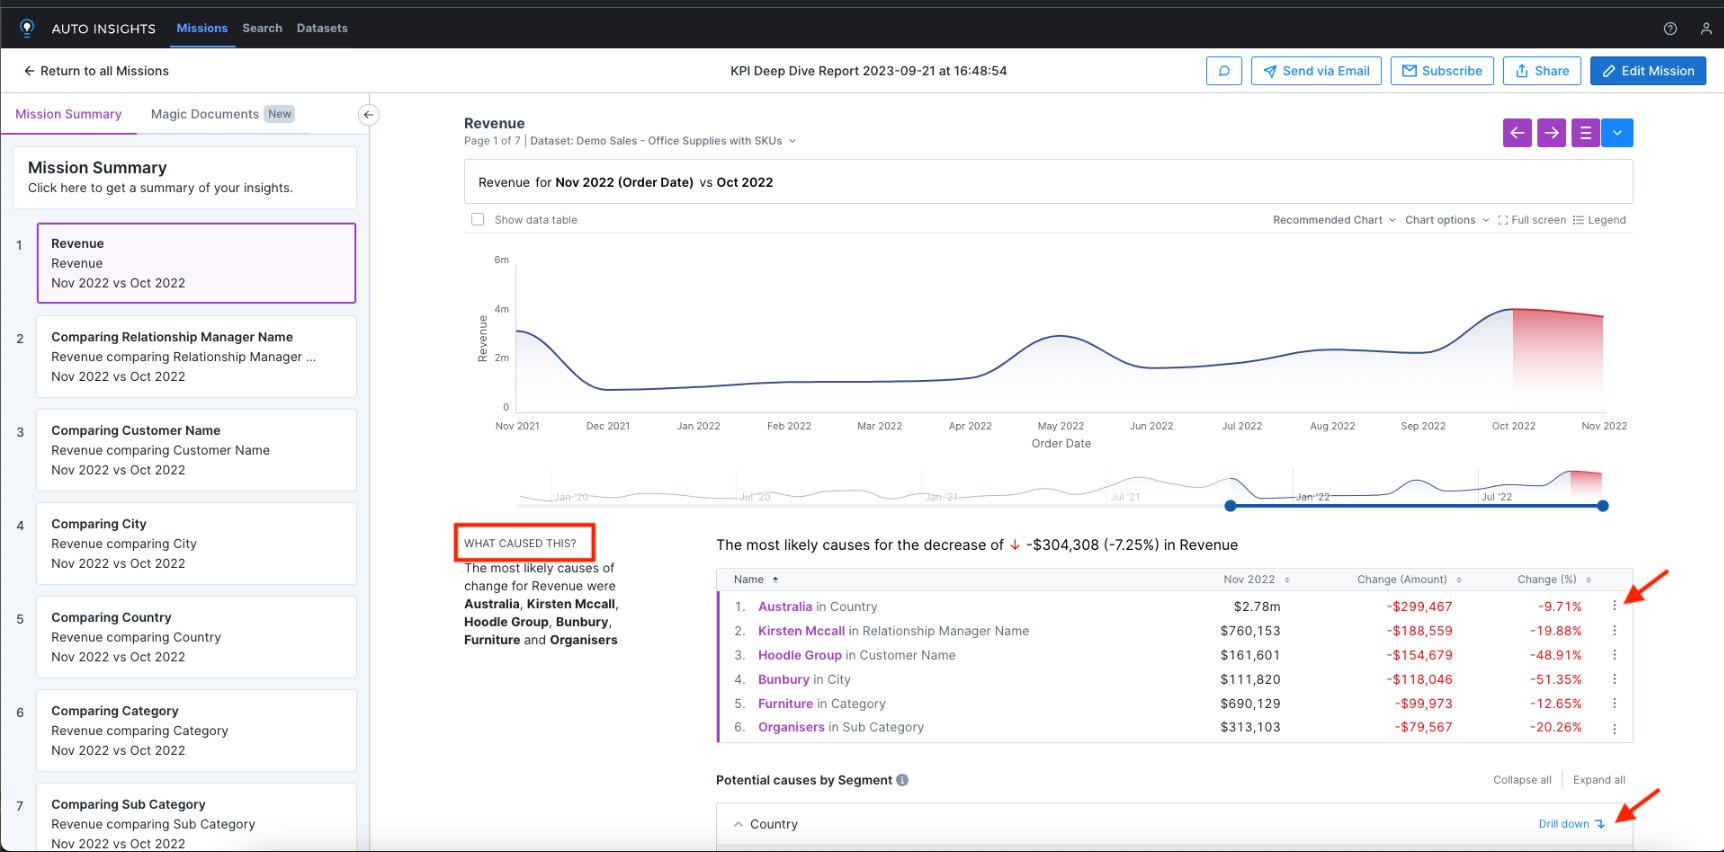
What Caused This
Easily explore and understand the contributing factors of change for each measure. To learn more about What Caused This methodology and explanation, refer to this article. To focus your analysis on a specific breakdown, select the ellipsis on the right to view trends over time. If you want to compare across all, select Drill down to get that comparison.