Quickstart for Dataprep by Trifacta
This page shows you how to get started using the Trifacta Application for Dataprep by Trifacta.
Before you begin
Before you begin, you may need to set up your project and your Dataprep by Trifacta account. For more information, see Getting Started with Dataprep by Trifacta.
Login
If you are not logged in to the Trifacta Application, please do the following.
Navigate to the Google Cloud Console. See https://console.cloud.google.com/dataprep.
In the Google Cloud Console, select the project where Dataprep by Trifacta has been enabled.
In the left nav bar, select Dataprep.
Basic Flow
In this quickstart, you complete the following steps. These steps mirror the basic task of any wrangling project:
Create a flow. A flow is a container for holding assets that you create or import in Dataprep by Trifacta.
Import datasets. This quickstart uses Federal Election Commission data from 2016. You import these publicly available datasets into your flow.
Wrangle your data. In the Trifacta Application, you create transformations and see them applied immediately to a sample of your data on-screen.
Gather a new sample. During the wrangling process, you may choose to collect a new sample from your data, which can provide different perspectives of your wrangling.
Run a job. After you have completed your wrangling steps in the Trifacta Application, you can run a job to perform these transformations across all of the datasets in your flow.
Download results. When the job completes, the generated results can be downloaded for use.
Create a flow
In the Trifacta Application, you build your projects in a container object called a flow. To your flow, you add datasets and create other objects such as recipes and outputs to construct the end-to-end pipeline of data into and out of the product.
Steps:
From the Home page, click the Flows icon

in the left nav bar.
In the Flows page, click Create. Select Create Flow.
Fill in a flow name and description. Since this quick start uses 2016 data from the United States Federal Elections Commission 2016, you may wish to name it, "FEC-2016", with a description that refers to this data.
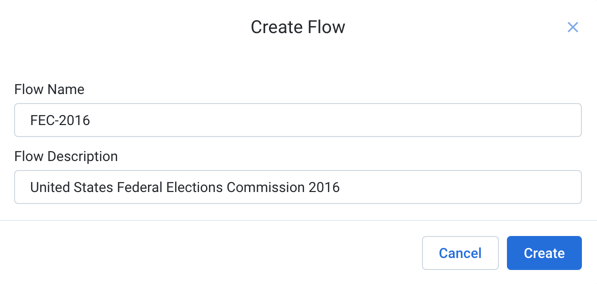
Figure: Create Flow dialog
Click Create.
The flow is created and displayed in Flow View:
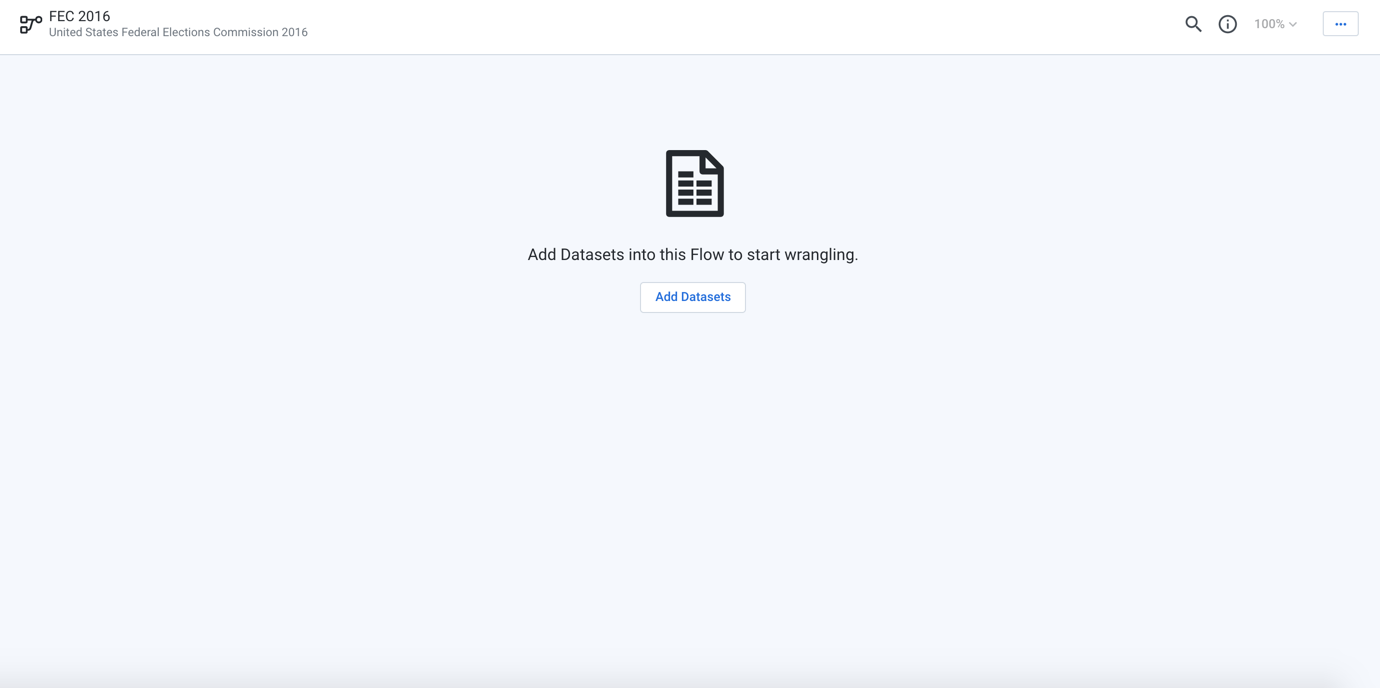
Figure: Flow View page
In Flow View, you can begin importing and building the objects of your flow.
Import datasets
Through Flow View, you can import datasets to begin your work. An imported dataset is a reference to a file, table, or view that you wish to transform.
Note
Dataprep by Trifacta does not modify source data. Instead, you develop your transformations on a sample of your source data and then apply those transformations through a job to generate results.
Steps:
From Flow View, click Add Datasets to open the Add Datasets to Flow page.
Click Import Datasets.
In the Import Data page, select GCS in the left panel.
Under Choose a file or folder, click the Pencil icon. Then, insert
gs://dataprep-samples/us-fecin the GCS text box. Click Go.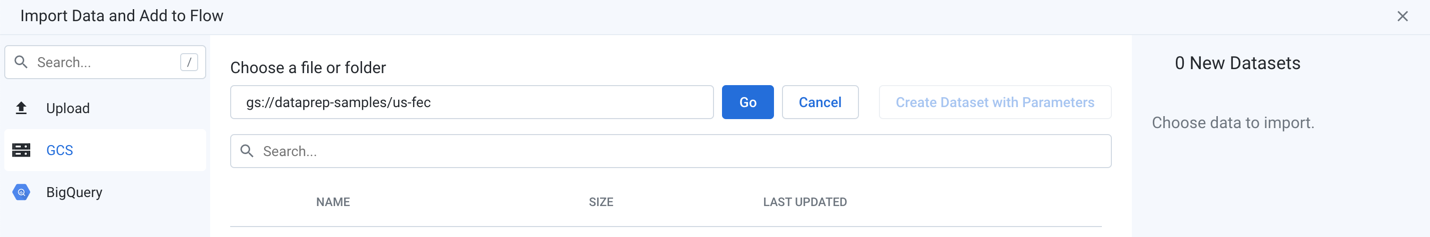
Figure: Import data from GCS
Select the
cn-2016.txtfile in the directory. In the right panel, enter the nameCandidate Master 2016.Now, select the
itcont-2016.txtdataset. In the right panel, enter the nameCampaign Contributions 2016.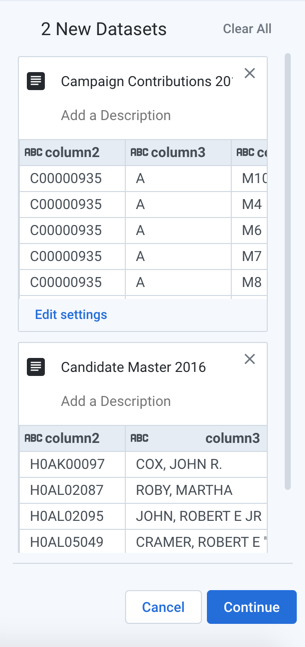
Figure: Two FEC datasets selected for import
After both datasets are listed and renamed in the right panel, click Continue to add the datasets to the flow.
Wrangle the Candidate file
To wrangle the contents of an imported dataset, you can create a recipe. A recipe is a series of transformation steps that are executed in sequence on the imported datasets that are connected to the recipe. In this section, you begin the process of building transformation steps in a recipe.
Steps:
On the FEC 2016 Flow page, select the Plus icon next to the Candidate Master 2016 dataset. Then, select Add new Recipe.
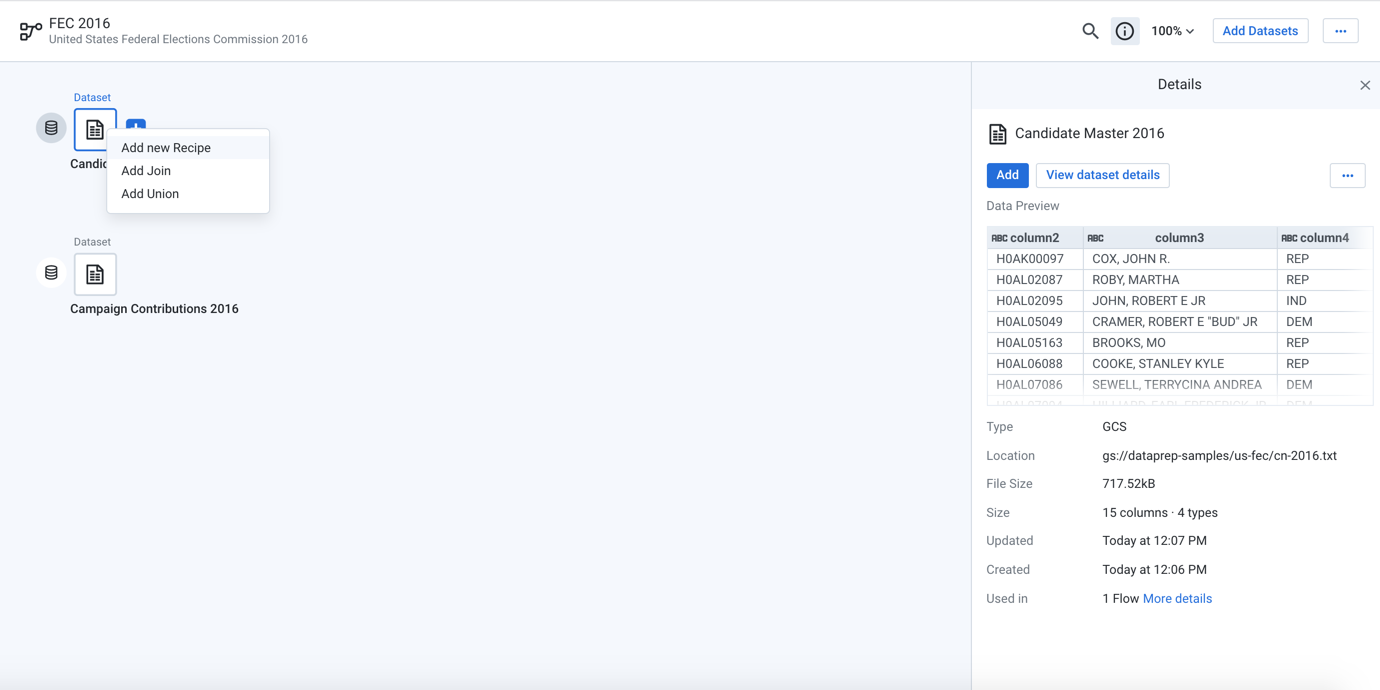
Figure: Add a new recipe for the Candidate Master 2016 imported dataset
A new recipe icon appears. In the right panel, click Edit Recipe.
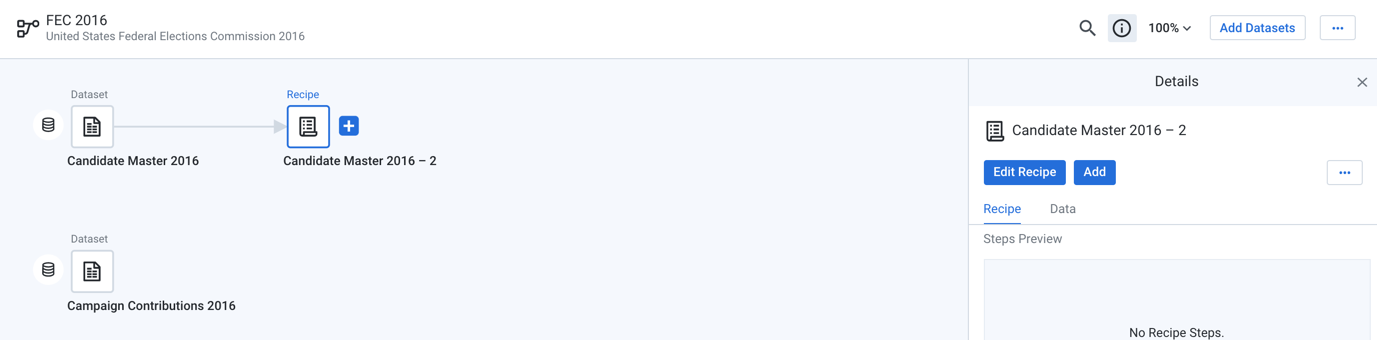
Figure: Edit a recipe
The Transformer page opens, where you can explore a sample of your data and build your recipe by applying transformation steps to it.
Note
The current sample is displayed in the upper left corner. In the example below, the sample is listed as Initial Data. The full dataset is small enough to be displayed in the browser. For larger datasets in which the full dataset is too large for display, this value is Initial Sample, which consists of the first set of lines from the imported dataset. The number of lines depends on the width of the dataset.
A recipe is created in the Recipe panel of the Transformer page. If the Recipe pane is not displayed on the right side of the page, click the Recipe icon at the top-right of the Grid view page.
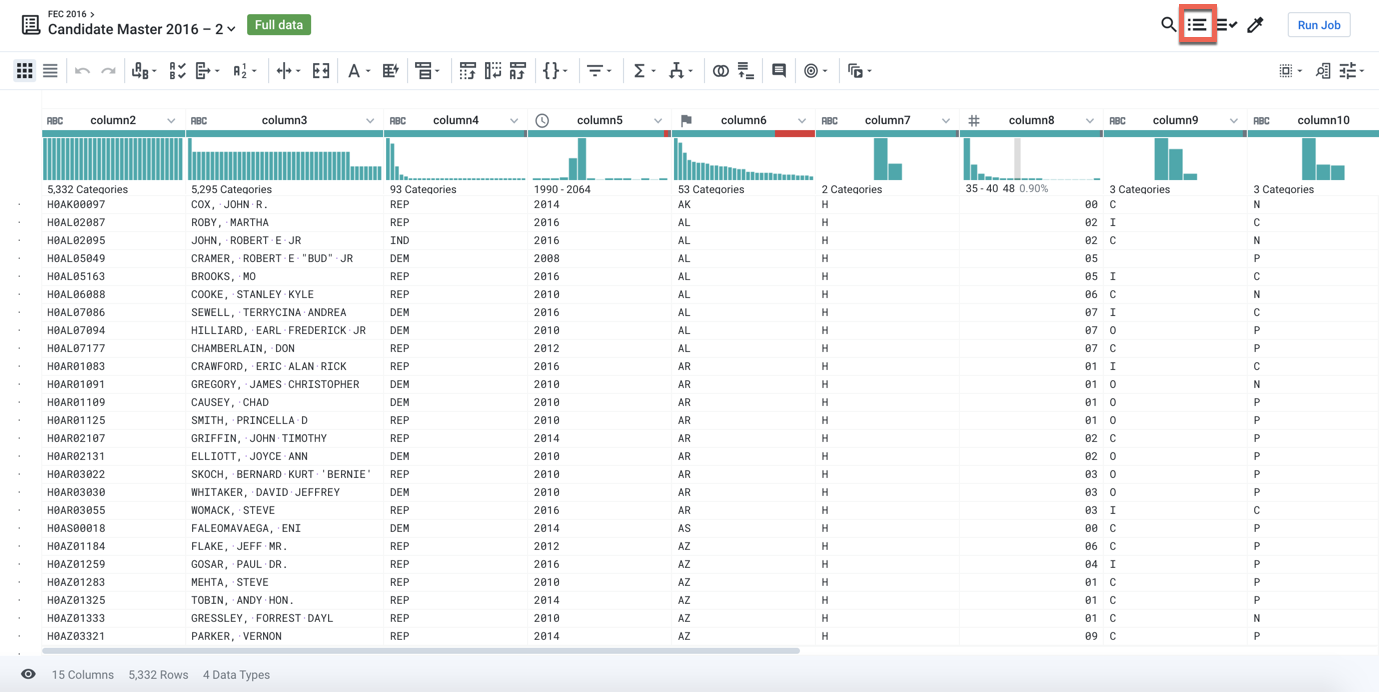
Figure: Recipe icon
In the Candidate Master 2016 dataset,
column5(Date/Time) contains values for years. Select the years 2016 and 2017 in the histogram by dragging across them.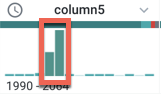
Figure: Select values from a column histogram to prompt suggestions
In the right panel, you should see a suggestion card titled "Keep rows where value is in selected range." Click Add.
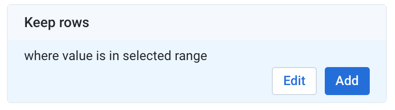
Figure: Suggestion card
The following recipe step is added to the recipe:
Transformation Name
Filter rowsParameter: Condition
Custom formula
Parameter: Type of formula
Custom single
Parameter: Condition
(date(2016, 1, 1) <= column5) && (column5 < date(2017, 1, 1))
Parameter: Action
Keep matching rows
In the
column6 (State)header, hover over and click the mismatched (red) bar to select the mismatched rows.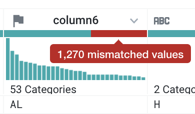
Figure: Click red bar to selected values in the column that do not match the column's data type.
In the Status bar at the bottom of the page, select the Show only affected checkbox. Notice that some the red highlighted (mismatched) items have the value "US" in column6 and "P" in column7. These are presidential candidates. The mismatch occurs because column6 is marked as a "State" column (indicated by the flag icon), but it also includes non-state (such as "US") values.
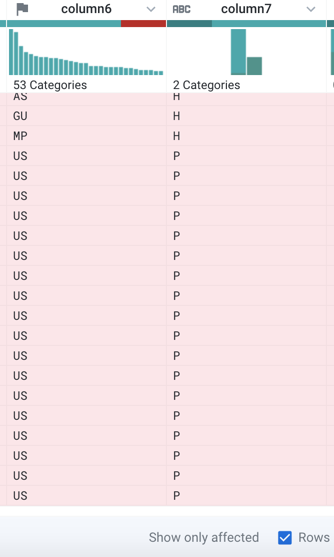
Figure: Click Show only affected checkbox in the Status bar.
To correct the mismatch, click the X in the right panel to cancel the transformation. The column must be re-typed as a column of String data type. Click the flag icon above column6 and select "String".
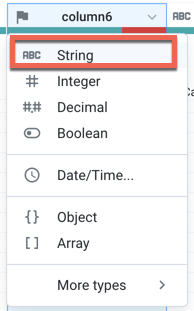
Figure: Change column data type
The column's data type is changed to String. String data type matches with any non-empty value in a column, which means that the mismatch is removed. The data quality bar is now completely green.
Now, let's filter on just the presidential candidates. In the histogram for column7, click the "P" bin.
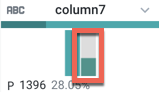
Figure: Select only "P" values.
In the right panel, you should see a suggestion card titled "Keep rows where column7 is 'P’:. Click Add.
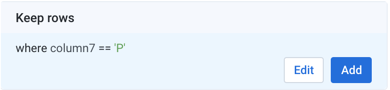
Figure: Choose to keep rows that contain "P" as the value in column7.
Wrangle the Contributions file and join it in
Now, you can transform the other imported dataset and join it into the first one.
Steps:
In the Transformer page, click FEC 2016 in the upper left corner to return to the Flow View page.
In Flow View, select Campaign Contributions 2016. Then, click the Plus icon next to it and select Add new Recipe.
In the right panel, click Edit Recipe to open a sample of the contributions dataset in the Transformer page.
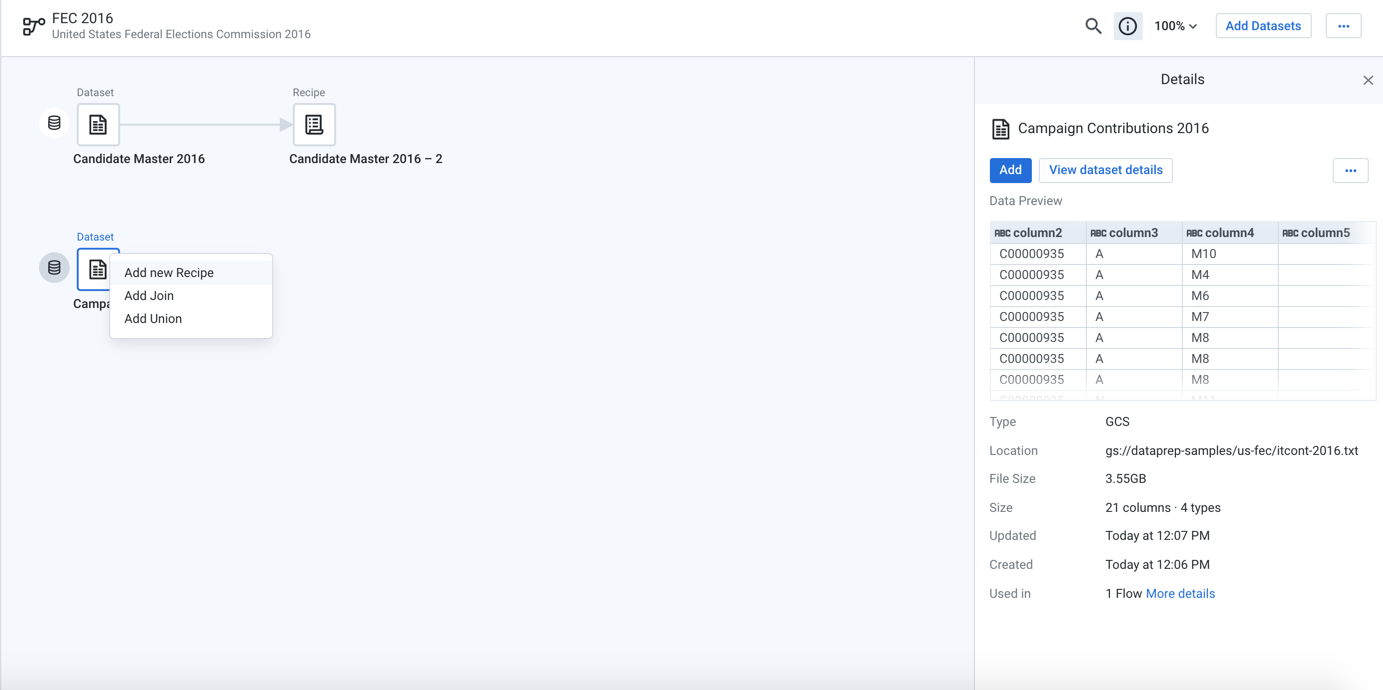
Figure: Create a new recipe for the Campaign Contributions 2016 dataset
In the Transformer page, open the Recipe panel. You can add a new step to the recipe that removes extra delimiters from the contributions dataset. Copy and paste the following Wrangle language command in the Search box:
replacepatterns col: * with: '' on: `{start}"|"{end}` global: true
Tip
You can copy and paste the raw Wrangle step into the Search box to add a recipe step.
The Transformation Builder parses the Wrangle command and populates the fields for the Replace text or patterns transformation. Click Add to add the transformation to the recipe.
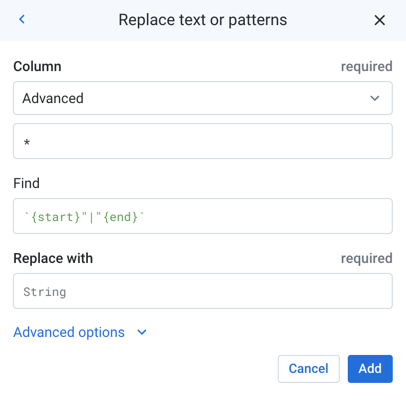
Figure: Copy and paste transformation steps
Joins: Let's join this dataset to the first one. Add another new step to the recipe, then type "Join" in the Search box.
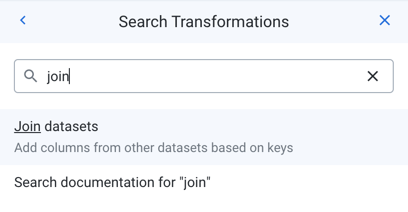
Figure: Search for "Join" transformation.
Click the Join datasets link to open the Joins page.
In the Join window, select the Recipes in current flow tab. Select Candidate Master 2016-2 (the Candidate Master dataset with the Recipe steps added above).
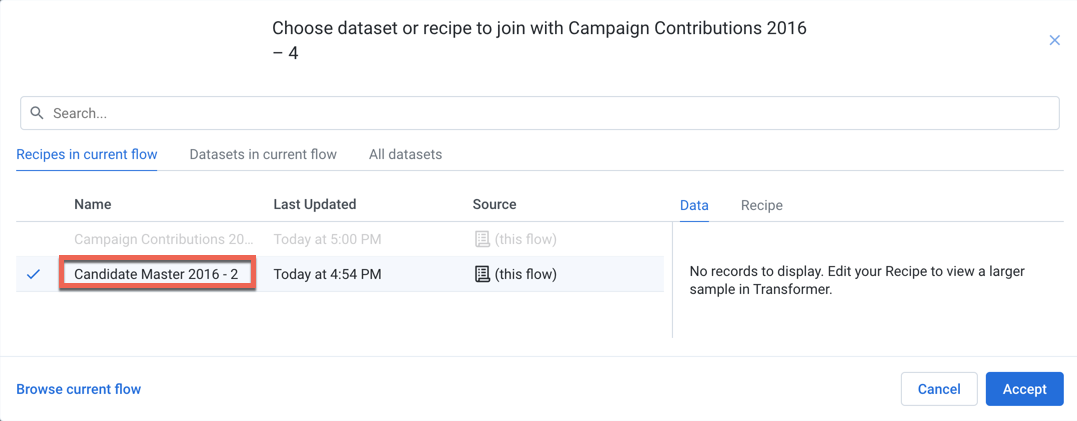
Figure: Join window
Click Accept.
In the Join window, you specify the keys and conditions of the join transformation. Dataprep by Trifacta infers some of these details for you. In this case, the join type (inner) is correct, but the join keys are not. In the panel on the right side, hover over them and click the Pencil icon.
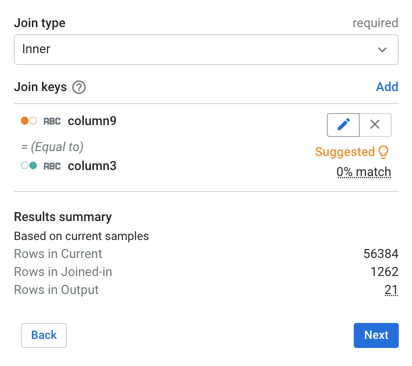
Figure: Specify join keys
For the join keys, please specify the following keys:
Current = column 2andJoined-in = column 11. Click Save and Continue.Click Next. In the Join - Output Columns window, select the checkbox immediately under the "All (36)" label which adds all columns of both datasets to the joined dataset:
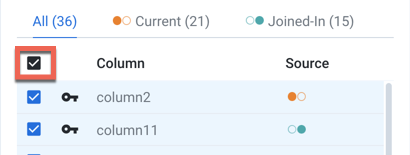
Figure: Select columns to include
Click Review. If all looks good, click Add to Recipe. In the Transformer page, the join transformation has been applied.
Create a summary: Add the following step to the recipe to generate a useful summary by aggregating, averaging and counting the contributions in column 16 and grouping on the candidates by IDs, names, and party affiliation in columns 2, 9, 8 respectively. Click New Step in the Recipe panel. Then, copy the following step and paste it into the Search box:
pivot value:sum(column16),average(column16),countif(column16 > 0) group: column2,column9,column8
The above statement is rendered as the following transformation:
Transformation Name
Pivot columnsParameter: Column labels
none
Parameter: Row labels
column2,column9,column8
Parameter: Values
sum(column16),average(column16),countif(column16 > 0)
A sample of the joined and aggregated data is displayed, representing a summary table of US presidential candidates and their 2016 campaign contribution metrics.
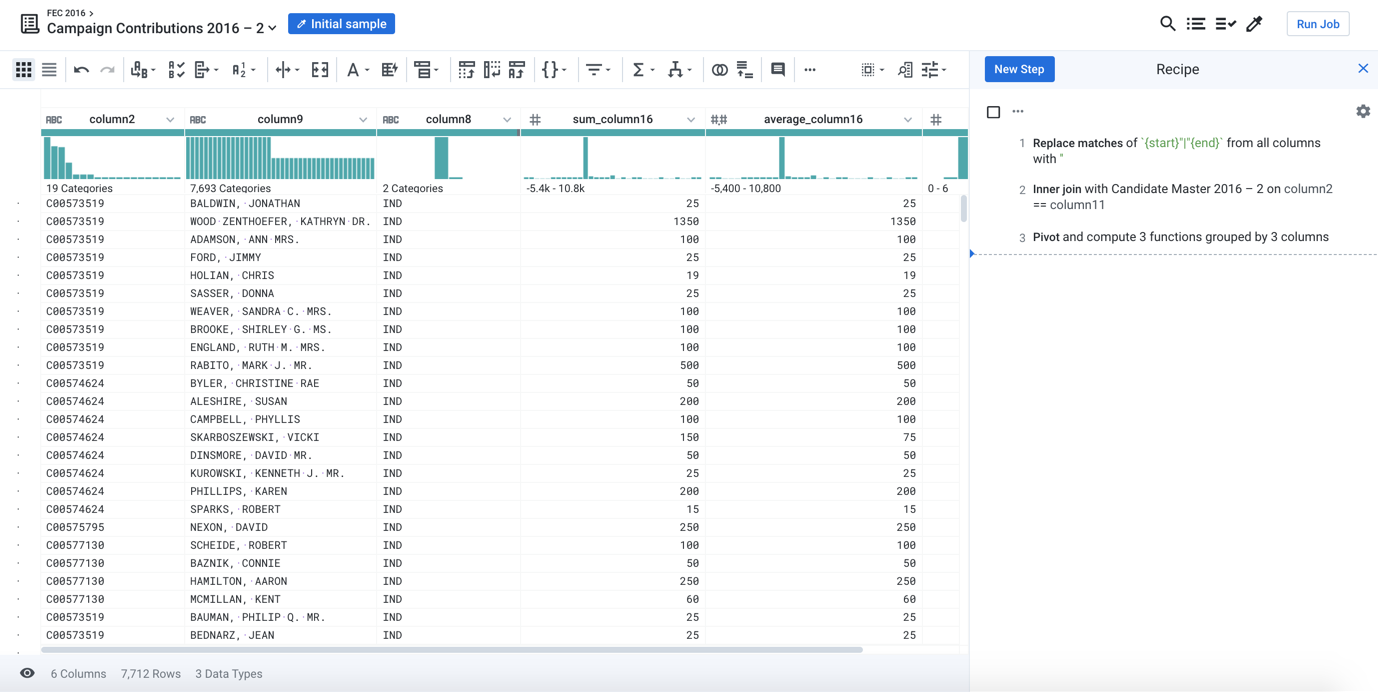
Figure: Transformer page after dataset has been joined in
You can make the data easier to interpret by pasting in the following renaming and rounding steps to the recipe.
rename type: manual mapping: [column9,'Candidate_Name'],
[column2,'Candidate_ID'],[column8,'Party_Affiliation'],
[sum_column16,'Total_Contribution_Sum'],
[average_column16,'Average_Contribution_Sum'],
[countif,'Number_of_Contributions']
set col: Average_Contribution_Sum value: round(Average_Contribution_Sum)
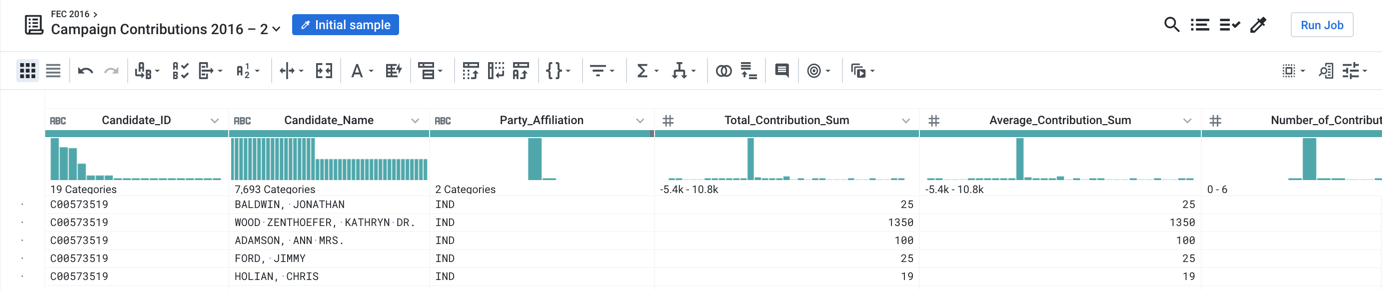
Figure: Joined datasets
Gather new samples
As needed, you can generate a different kind of sample of your data, which helps to locate outliers and to verify that your transformation steps apply to all rows in the dataset.
Note
The example FEC dataset displays the Initial Data sample, so gathering a new sample is less important in this case. For larger datasets, you may need to gather new examples at various stages during recipe development.
Steps:
To view more data, mouse over the "Initial Sample" link at the top-left of the page.
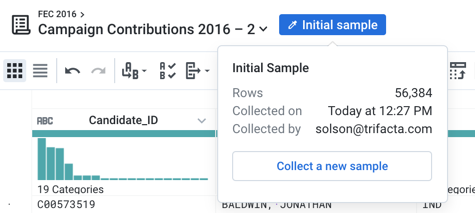
Figure: Sample drop-down
Click Collect a new sample.
In the Samples panel, select a random, quick sample, then click Collect.
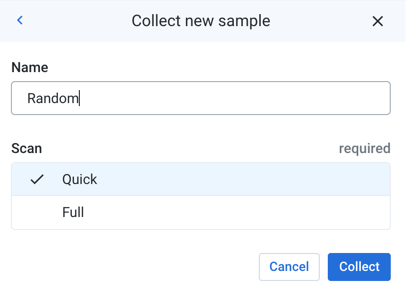
Figure: Collect new random sample
After the job completes, click Load Sample in the Samples panel to load the new sample into the Transformer page.
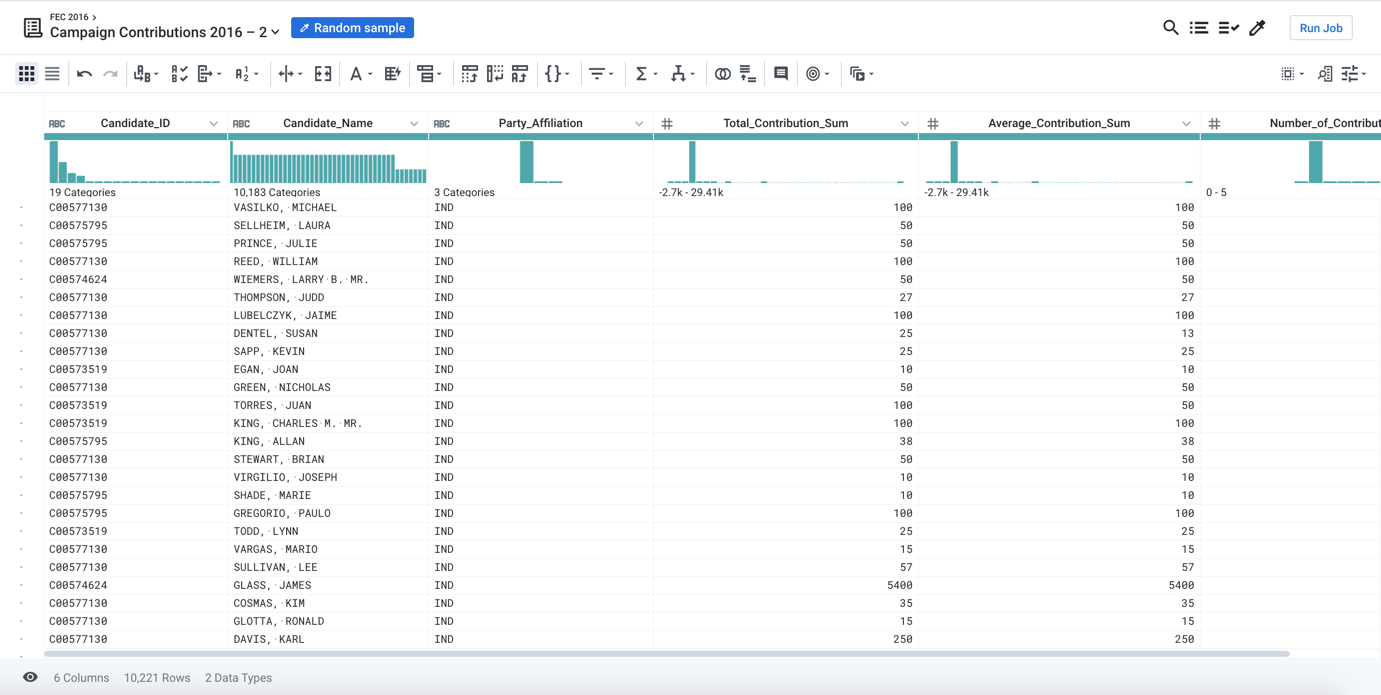
Figure: New sample loaded in the Transformer page
Run a job
You can now run a job to apply your changes across the entire joined dataset. In the Transformer page, click Run Job.
In the Run Job page:
Select the Profile Results checkbox. When a profile is generated, you can review a statistical and visual summary of the results of your job, which is useful for evaluating the quality of your transformations.
By default, a CSV file is generated with your job. Suppose you want to add a JSON output file, too. Click Add Publishing Action.
Click Create a new file.
Specify a new name for the file if desired.
For the Data Storage Format, select
JSONfrom the drop-down.You can explore the other options if you want. Click Add. The publishing action is added to your job specification.
Depending on how your project is configured, you may be required to select a running environment where your job is executed. The following running environments may be available for selection:
Tip
The Trifacta Application selects a default running environment for you based on the estimated size of the jobs. Costs may be associated with running the job.
Trifacta Photon: This in-memory running environment yields faster performance best suited for small- to medium-sized jobs.
Dataflow: This running environment is hosted in the Google Cloud Platform and is best suited for larger jobs.
Click Run Job.
The job is queued for execution in Dataflow.
Tracking progress: In Flow View, you can see the progress of the job in the right panel. To explore details, click the Job Id link.
Profile: When the job completes successfully, click the Profile tab to see the visual profile of your job results.
Export Results: Click the Output Destinations tab. The output files are listed. From a file's context menu, you can click View on Google Cloud Storage. You can download from there.