Job Details Page
You can use the Job Details page to explore details about successful or failed jobs, including outputs, dependency graph, and other metadata. Download results to your local desktop or, if enabled, explore a visual profile of the data in the results for further iteration on your recipe.
Note
If the job is executed in an environment other than Trifacta Photon, the job is queued for execution in the environment. Jobs executed on a remote cluster may incur additional overhead to spin up execution nodes, which is typically within 10-15 seconds. During job execution, the Designer Cloud Powered by Trifacta platformobserves the job in progress and reports progress as needed back into the application. The Designer Cloud Powered by Trifacta platform does not control the execution of the job.
Page options:
Cancel job: Click this button to cancel your job while it is still in progress. This button may not appear until the queued job has been submitted to the running environment.
Note
This option may not be available for all running environments. Job cancellation is not supported in high-availability deployments.
Publish results: Publish your results to an external system. For more information, see Publishing Dialog.
Delete job: Delete the job and its results.
Warning
Deleting a job cannot be undone.
Note
This feature may not be enabled in your environment. For more information, see Miscellaneous Configuration.
Download logs: Download the log files associated with this job.
Tip
When jobs fail, the downloaded package includes additional configuration files and service logs to assist in debugging job execution issues. For more information, see Support Bundle Contents.
Download profile as PDF: If visual profiling was enabled for the job, you can download the profile in PDF format.
Download profile as JSON: If visual profiling was enabled for the job, you can download a JSON representation of the profile to your desktop.
Overview Tab
In the Overview tab, you can review the job status, its sources, and the details of the job run.
Note
If your job failed, you may be prompted with an error message indicating a job ID that differs from the listed one. This job ID refers to the sub-job that is part of the job listed in the Job summary.
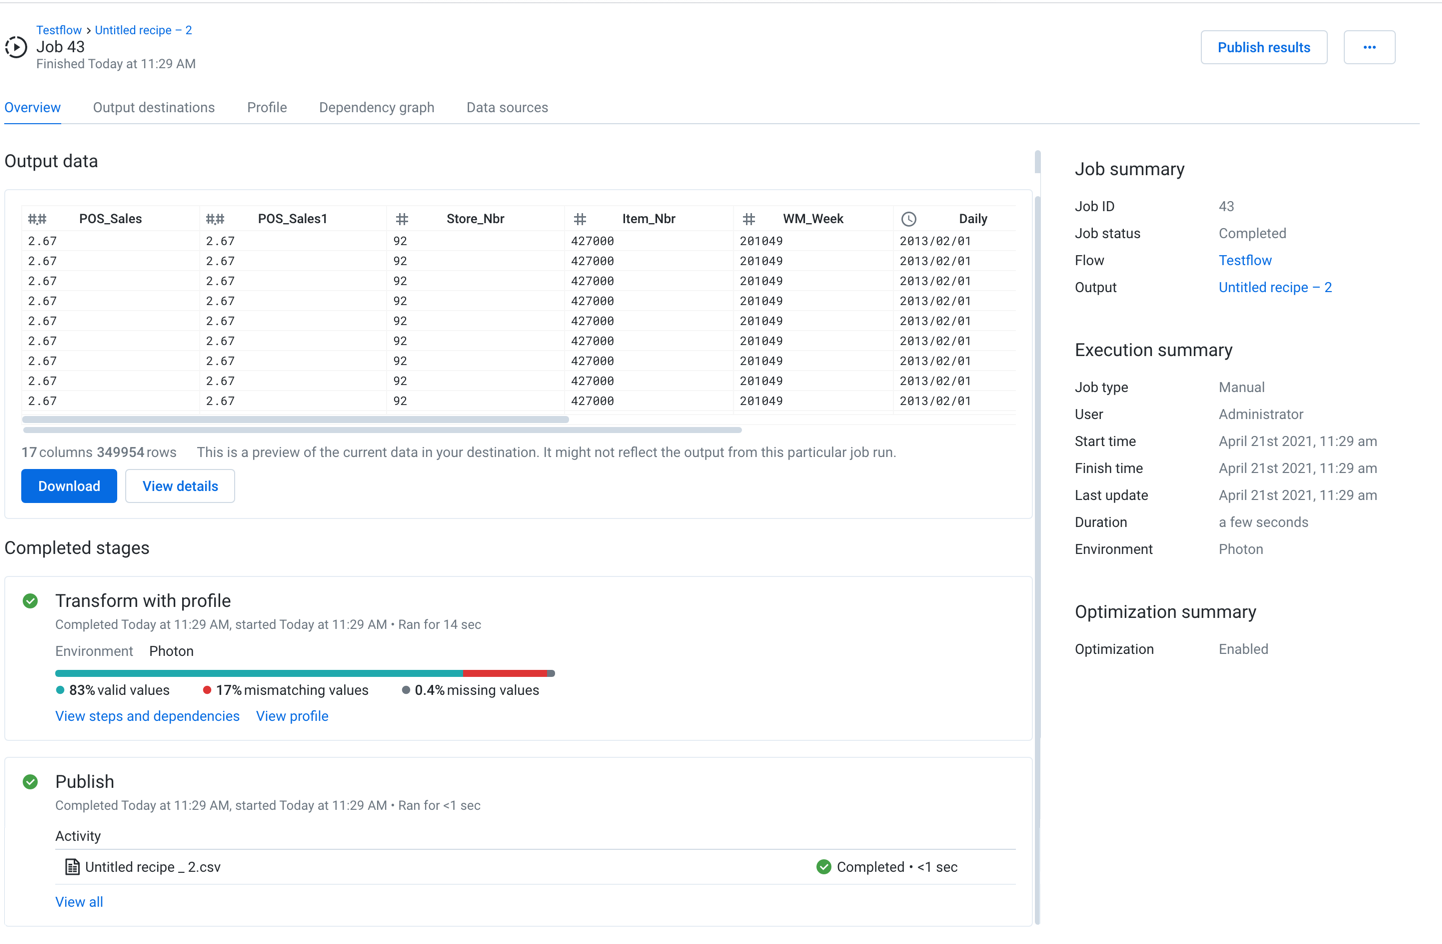
Figure: Overview tab
You can review a snapshot of the results of your job.
Output Data:
The output data section displays a preview of the generated output of your job.
Note
This section is not displayed if the job fails.
You can also perform the following:
View: If it is present, you can click the View link to view the job results in the datastore where they were written.
Note
The View link may not be available for all jobs.
Download : If it is present, click the Download link to download the generated job results to your local desktop.
View details: Click View details to view the generated results in the side bar. See the Output Destinations below.
Completed Stages:
This panel provides information on the progress and completion status of each stage of the job execution.
Tip
Depending on the operation, you may be able to monitor transfer rate performance for larger datasets.
Connect:The platform is attempting to connect to the datastore hosting the asset sources for the datasets.
Schema validation: When enabled, the schemas of a job's datasources are checked as the first step of job execution.
Datasets with changes in them are reported at the top of the list. Click View all to see schema validation for all of the datasets used in the job in the Data sources tab.
Optionally, the job can be halted if there are differences between the schema that is read and the schema that has been stored from the previous job run. This option can prevent data corruption.
If no errors are detected, then the job is completed as normal.
For more information on schema validation, see Overview of Schema Management.
Request:The platformis requesting the set of assets to deliver.
Ingest:Depending on the type of source data, some jobs ingest data to the base storage layer in a converted format before processing begins. This ingested data is purged after job completion.
Prepare:(Publishing only)Depending on the destination, the Prepare phase includes the creation of temporary tables, generation of manifest files, and the fetching of extra connections for parallel data transfer.
Transfer:Assets are transferred to the target, which can be the platform or to the output datastore.
Transform: This stage covers the execution of your recipe steps in order to transform the source data.
Profile: If you chose to profile your output data, this stage is completed after transformation is complete. Results are available in the Profile tab.
Note
If you chose to generate a profile of your job results, the transformation and profiling tasks may be combined into a single task, depending on your environment. If they are combined and profiling fails, any publishing tasks defined in the job are not launched. You may be able to ad-hoc publish the generated results. See below.
Publish: This stage covers the writing of the outputs of the transformed data. These outputs are available through the Output destinations tab.
Process:Cleanup after data transfer, including the dropping of temporary tables or copying data within the instance.
For more information, see Overview of Job Monitoring.
If present, you can click the Show Warnings link to see any warnings pertaining to recipe errors, including the relevant step number.To review the recipe and dependencies in your job, click View steps and dependencies. See the Dependencies tab below.
If you chose to profile results of your job, click View profile to review. See Profile tab below.
A visual profile provides a graphical snapshot of the results of a successful transformation job for the entire dataset and individual columns in the dataset.
If your job output specified SQL scripts to run before or after job execution, you can track their progress in the following stages:
Pre-ingest SQL: Script that is configured to run before the source data is ingested to the platform.
Post-publish SQL: Script that is configure to run after the output data has been published.
For additional details, see the SQL scripts tab below.
For more information on SQL scripts in job execution, see Create Output SQL Scripts.
Publish:
You can also review the outputs generated as a result of your job. To review and export any of the generated results, click View all. See Outputs Destinations tab below.
Job summary:
Job ID: Unique identifier for the job
Tip
If you are using the REST APIs, this value can be used to retrieve and modify specifics related to this job.
Job status: Current status of the job:
Queued:Job has been queued for execution.Running:Job is in progress.Completed: Job has successfully executed.Note
Invalid steps in a recipe are skipped, and it's still possible for the job to be executed successfully.
Failed:Job failed to complete.Note
You can re-run a failed job from the Transformer page. If you have since modified the recipe, those changes are applied during the second run.
Canceled: Job was canceled.
Flow: Name of the flow from which the job was executed. Click the link to open the flow.
Output: Name of the output object that was used to define the generated results. Click the link to open the output.
Execution summary:
Job type: The method by which the job was executed:
Manual- Job was executed through the application interface.
Scheduled- Job was executed according to a predefined schedule. See Add Schedule Dialog.
User: The user who launched the job
Environment: Where applicable, the running environment where the job was executed is displayed.
Start time: Timestamp for when processing began on the job. This value may not correspond to when the job was queued for execution.
Finish time: Timestamp for when processing ended on the job, successful or not
Last update: Timestamp for when the job was last updated
Duration: Elapsed time of job execution
Optimization summary:
For jobs sourced from relational datasets, you can optionally enable SQL-based optimizations, which apply some of the steps specified in your recipe back in the datasource, where they can be executed before the data is transferred to the running environment for execution. Using these optimizations means faster performance based on a lower volume of data transfer.
Workspace administrators must enable the optimization feature for the workspace. For more information, see Workspace Settings Page.
When the feature is enabled, optimizations must be enabled for each flow. You can also select the optimizations to apply.
When optimizations have been applied to your flow, they are listed on the Overview tab:
Optimization: This setting is displayed if flow optimizations have been enabled for this flow.
Columns pruned: If one or more unused columns have been pruned in the datasource via SQL, the count of columns is listed here.
Filters pushed down: If one or more row filters has been applied in the datasource via SQL, the count of filters is listed here.
If an optimization is disabled or was not applied to the job run, it is not listed.
Output Destinations Tab
If the job has successfully completed, you can review the set of generated outputs and export results.
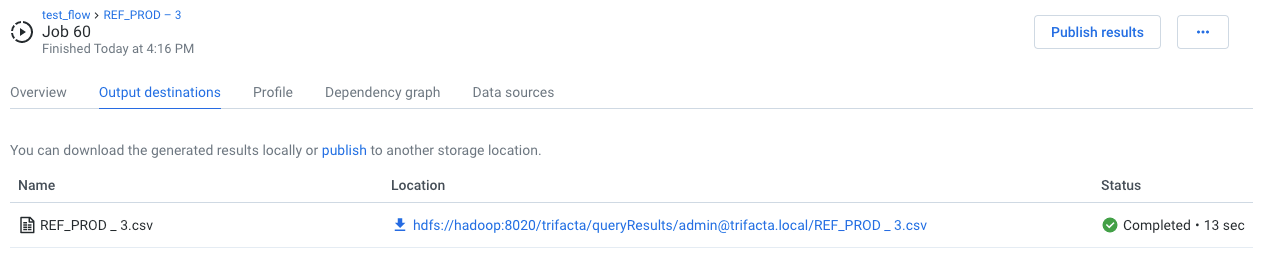
Figure: Output Destinations tab
Actions:
For each output, you can do the following:
View details: View details about the generated output in the side bar.
Tip
The View details panel contains breakdowns for each phase of a job. If the job fails, you can review error messages, which correspond to entries in the Data Service log file.
Download result: Download the generated output to your local desktop.
Note
Some file formats may not be downloadable to your desktop. See below.
Create imported dataset: Use the generated output to create a new imported dataset for use. See below.
Note
This option is not available for all file formats.
Direct file download
Click one of the provided links to download the file through your browser to your local desktop.
Note
If these options are not available, data download may have been disabled by an administrator.
HYPER: You can download HYPER formatted outputs to your desktop.
If you have generated output in a Tableau format and have configured a connection to Tableau Server, you can publish directly to the server. SeePublishing Dialog.
Create imported dataset
Optionally, you can turn your generated results into new datasets for immediate use in the Designer Cloud Powered by Trifacta platform. For the generated output, select Create imported dataset from its context menu.
Note
OTE: If you generated results in Parquet format only, you cannot create a dataset from it, even if the Create button is present. This is a known issue.
Note
When you create a new dataset from your job results, the file or files that were written to the designated output location are used as the source. Depending on your backend datastore permissions are configured, this location may not be accessible to other users.
Publish
If the Designer Cloud Powered by Trifacta platform is connected to an external storage system, you may publish your job results to it. Requirements:
Your version of the product supports publishing.
Your connection to the storage system includes write permissions.
Your results are generated in a format that the target system supports for writing.
All sub-jobs, including profiling, successfully completed.
For more information, see Publishing Dialog.
SQL scripts Tab
If the output for your job included one or more pre- or post-job SQL script executions, you can review the status of their execution during the job.
Note
If a SQL script fails to execute, all downstream phases of the job fail to execute.
Tip
If the SQL script execution for this job encountered errors, you can review those errors through this tab. For more detailed information, click Download logs.
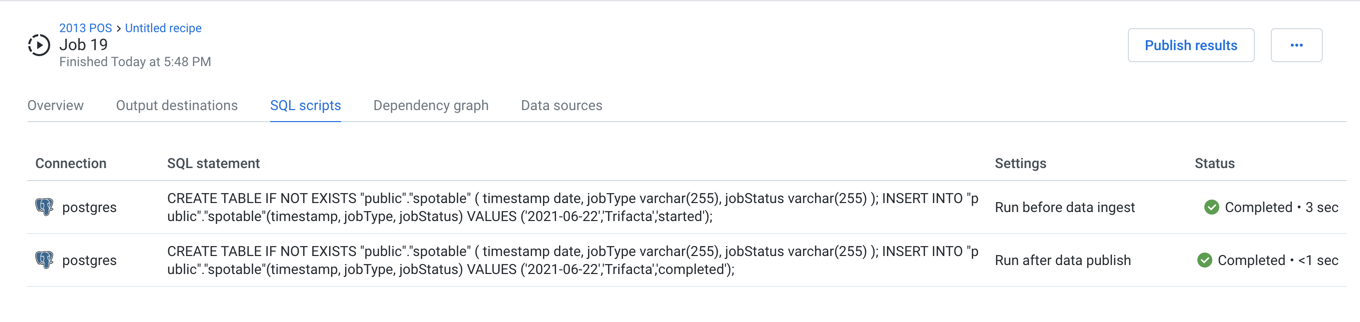
Figure: SQL scripts tab
Columns:
Connection: Name of the connection through which the script was executed.
SQL statement: The first part of the SQL script that was executed.
Settings:
Run before data ingest- script was executed pre-job.Run after data publish- script was executed post-job, after the job results had been written.
Status: Current status and execution duration of the SQL script.
Note
If you have multiple SQL scripts for each settings, they may execute in parallel. For example, if you created three pre-job SQL scripts, there is no guarantee that they executed in the order in which they are listed.
View details:
Hover over a SQL script entry and click View details.
In the SQL script details window, you can review:
Connection and SQL of the executed script.
Any error messages that occurred during execution.
Tip
To review log information for any error messages, click Download logs.
For more information on these types of SQL scripts, see Create Output SQL Scripts.
Profile Tab
Review the visual profile of your generated results in the Profile tab. Visual profiling can assist in identifying issues in your dataset that require further attention, including outlier values.
Note
This tab appears only if you selected to profile results in your job definition.
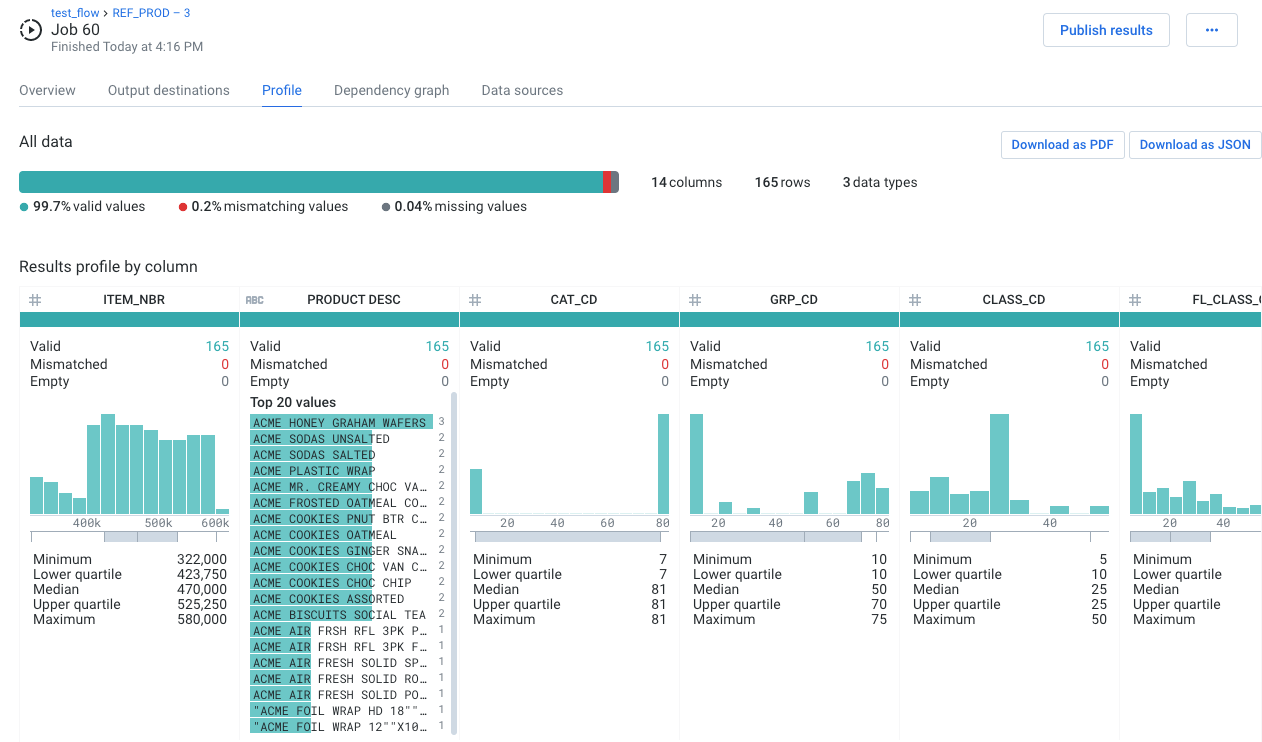
Figure: Profile tab
Download as PDF: Download your visual profile and results of your data quality rules on the entire dataset as a PDF file.
Download as JSON: Download your visual profile as a JSON file.
In particular, you should pay attention to the mismatched values and missing values counts, which identify the approximate percentage of affected values across the entire dataset.
Note
The computational cost of generating exact visual profiling measurements on large datasets in interactive visual profiles severely impacts performance. As a result, visual profiles across an entire dataset represent statistically significant approximations.
Note
Designer Cloud Powered by Trifacta Enterprise Edition treats null values as missing values. Imported values that are null are generated as missing values in job results (represented in the gray bar).
Tip
Mouse over the color bars to see counts of values in the category.
Tip
Use the horizontal scroll bar to see profiles of all columns in wide datasets.
In the lower section, you can explore details of the transformations of individual columns. Use this area to explore mismatched or missing data elements in individual columns.
Depending on the data type of the column, varying information is displayed.
Tip
You should review the type information for each column, which is indicated by the icon to the left of the column.
Dependency graph Tab
In this tab, you can review a simplified representation of the flow from which the job was executed. This flow view displays only the recipes and datasets that contributed to the generated results.
Tip
To open the full flow, you can click its name in the upper-left corner.
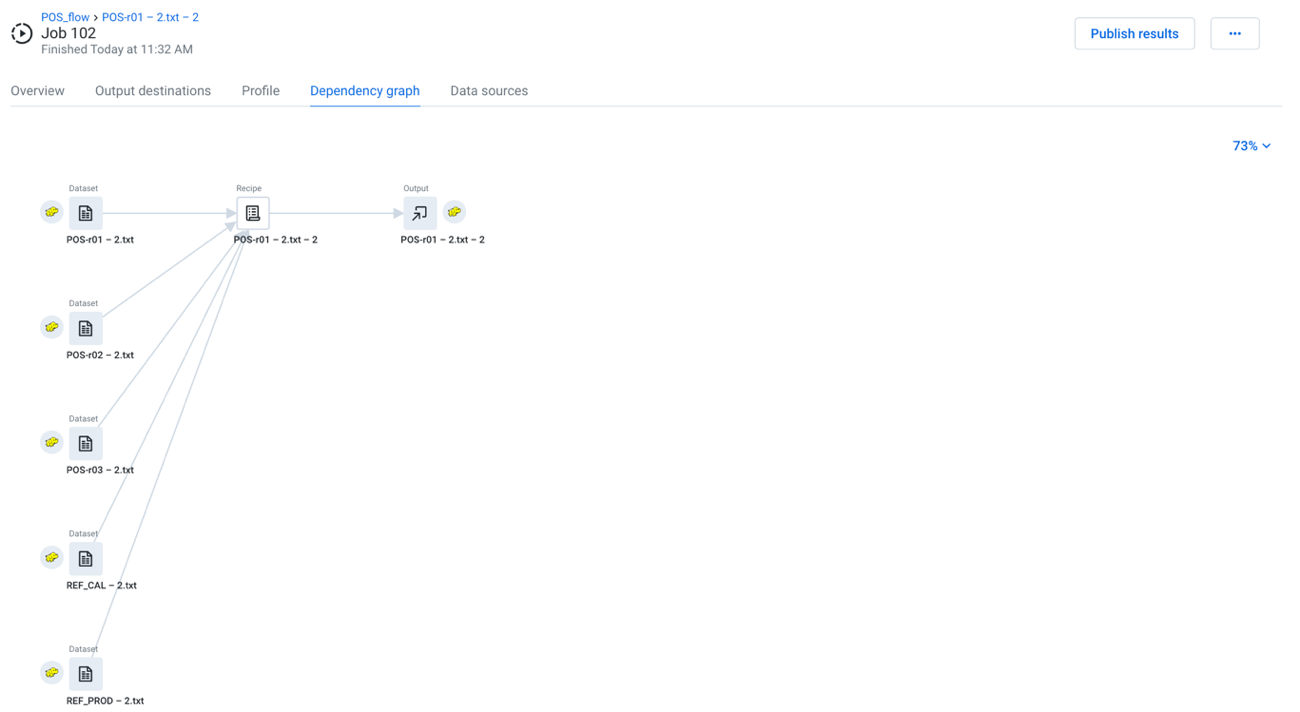 |
Figure: Dependency graph tab
Zoom menu:
You can zoom the dependency graph canvas to display areas of interest in the flow graph.
The zoom control options are available at the top-right corner of the dependency graph canvas. The following are the available zoom options:
Tip
You can use the keyboard shortcuts listed in the zoom options menu to make quick adjustments to the zoom level.
Zoom in: Zoom in 10% on the canvas to focus on greater detail.
Zoom out: Zoom out 10% from the canvas to see more of it.
Zoom to fit: Change the zoom level to fit all of the objects of your flow onto the screen.
25%, 50%, or 100%: Change the zoom level to one of the preset levels.
Recipe actions:
Download recipe: Download the text of the recipe in Wrangle.
Display Wrangle/natural language: Toggle display of the recipe in raw language or in readable language.
Limitations:
You can select only recipes in the flow graph.
Context controls and menus are not available.
Data sources Tab
In the Data sources tab, you can review all of the sources of data for the executing recipe.
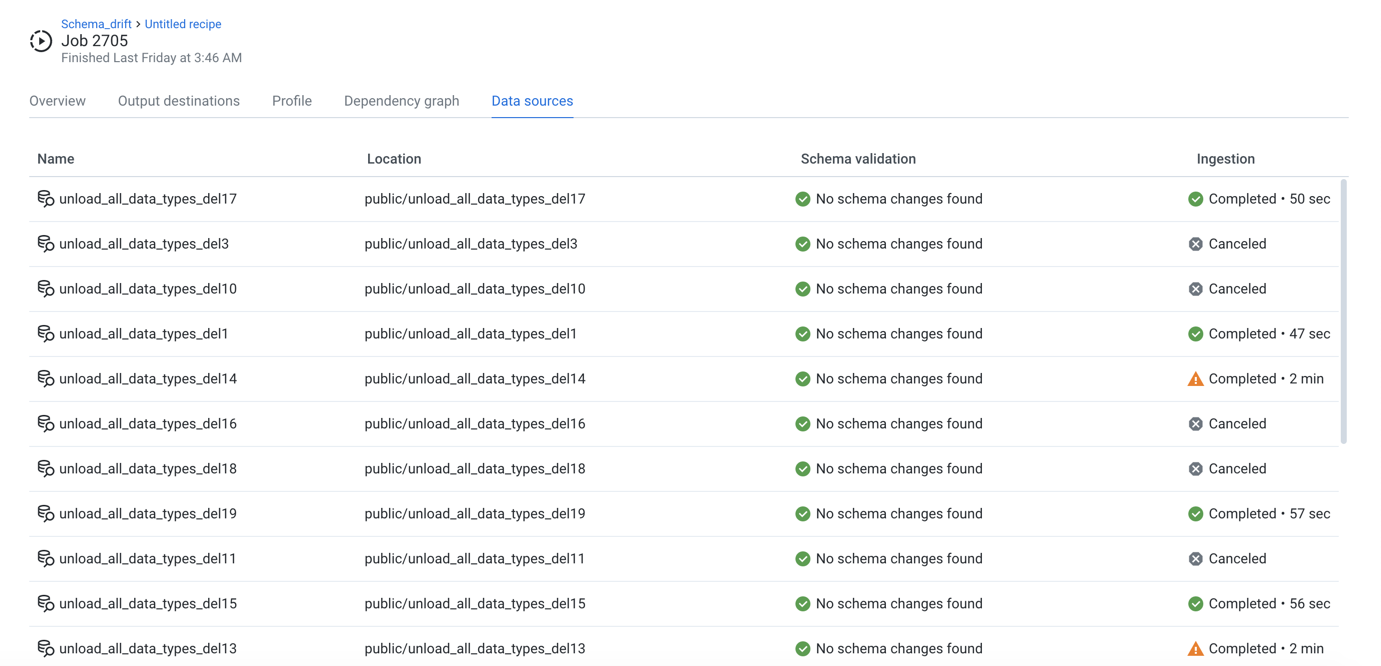
Figure: Data sources tab
Note
If a flow is unshared with you, you cannot see or access the datasources for any jobs that you have already run on the flow, including any PDF profiles that you generated. You can still access the job results. This is a known issue.
Schema validation:
If schema validation has been enabled, you can review validation errors for individual datasets. For more information, see Schema Changes Dialog.
Datasets with parameters:
If your source is a dataset with parameters, you can review and count the individual files that were matched and imported.
For the imported dataset, click View details. Then, click the Files tab in the context panel.
This tab can be a good check to ensure that you have specified your dataset parameters correctly.
Parameters Tab
If your flow references parameters, you can review the state of the parameters at the time of job execution.
Note
This tab appears only if the job is sourced from a flow that references parameters. For more information, see Overview of Parameterization.
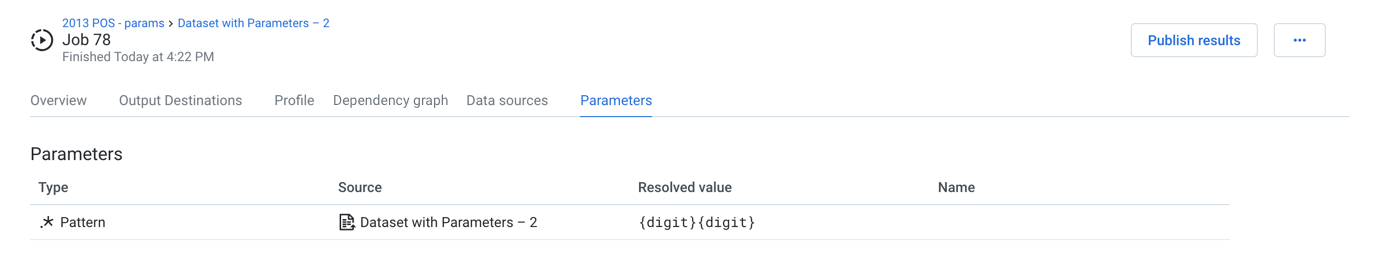
Figure: Parameters tab
Webhooks Tab
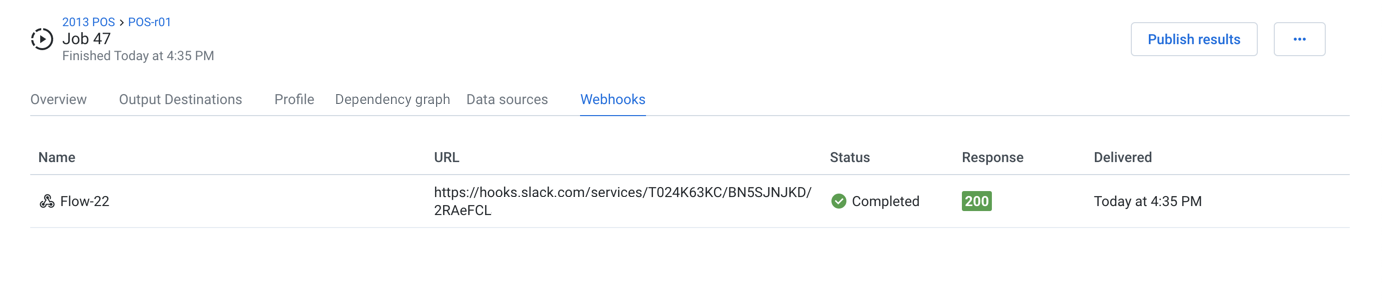
Figure: Webhooks Tab
When a webhook task has been triggered for this job, you can review the status of its delivery to the target system.
Webhooks are defined on a per-flow basis. For more information, see Create Flow Webhook Task.
Note
Webhook notifications may need to be enabled in your environment. See Workspace Settings Page.
Columns:
Name: Display name for the webhook task.
URL: Target URL where the webhook notification is delivered.
Status: HTTP status code returned from the delivery of the message.
200- message was delivered successfully.
Delivered: Timestamp for when the webhook was delivered.