Measures in Auto Insights
Now that you've uploaded your dataset and customized the calculations applied to each column, these additional configurations will make your dataset ready for business use.
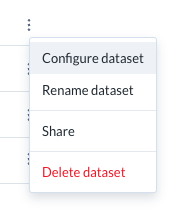
On the Datasets page, select the three-dot menu next to your dataset, then select Configure dataset.
Select Configuration to access the Measures settings.
Column Name
You can edit the name of the column by entering a new name in the Column Name field.
Cuidado
Renaming the column doesn't automatically rename references to this column within saved Preset Reports and Custom Reports. Existing queries referencing this column will need to be updated.
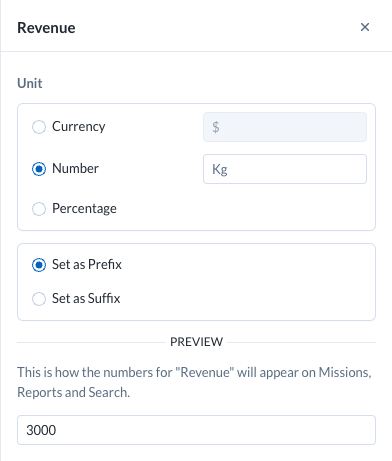
Units
You can select from Currency, Number, or Percentage units for your measure, and whether this is shown as a prefix or suffix.
The Percentage option defaults to a suffix, and Currency defaults to a prefix. You can change both if needed. The preview displays how your measure will look with the Units configuration applied.
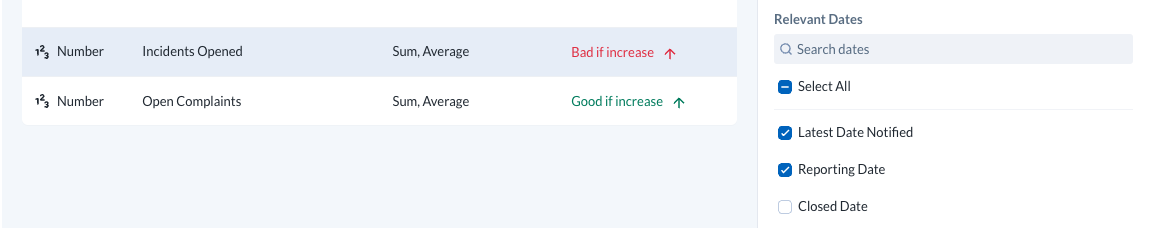
Relevant Dates
Within your use case, there might be a few different dates in the dataset relevant to only specific measures (for example, Incidents Opened wouldn't have a Closed Date).
In the Measures settings, you can turn off irrelevant dates. This helps reduce confusion when users select dates for analysis.
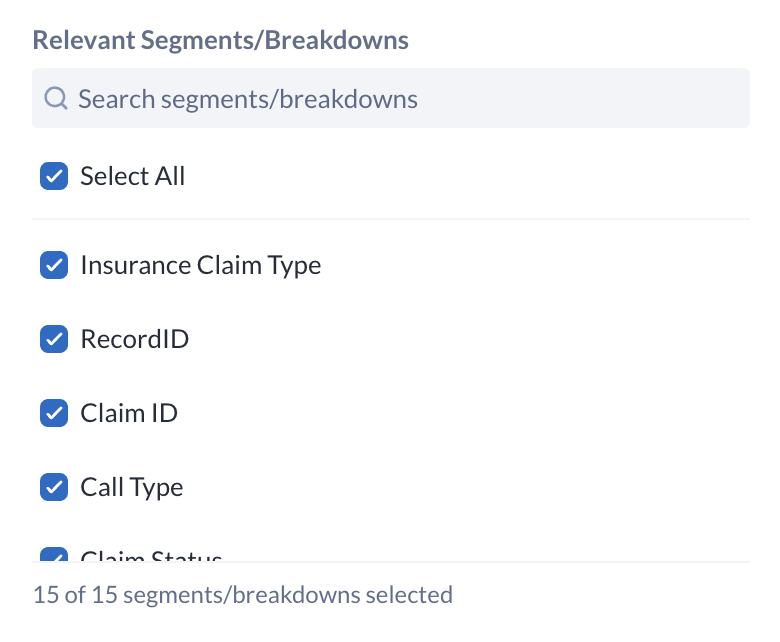
Relevant Segments
In your use case, it may be appropriate to restrict certain segments so that only the most relevant ones can be used as dimensions for comparing metrics, while disabling those that do not add analytical value. Columns that are disabled from Relevant Segments/Breakdowns are also not shown in the 'What Caused This?' analysis for that measure. For more information, go to Relevant Segments and Breakdowns
 |
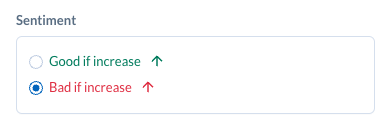
Sentiment
You can define whether an increase in a measure is positive or negative (for example, higher sales are good, but higher costs are not). This is called Sentiment and affects how charts and data stories appear in Explore Data Insights, Preset Reports, and Custom Reports. If a measure is neither positive nor negative, it can be configured as Neutral and will be displayed accordingly.
Select the appropriate radio button to adjust the sentiment.