Guide for Tableau Users
Discover how you can take your data to the next level with Auto Insights to uncover invaluable data insights in an instant. Master the art of data preparation, explore Auto Insights' unique data categorization, and optimize the ideal data structure. Learn to reformat your data like a pro while navigating the differences between Alteryx Designer workflow outputs in Tableau and Auto Insights. By the end of this post, you'll be ready to harness the power of Auto Insights, transforming your data analysis skills into pure wizardry!
Getting started
Understanding data preparation and structuring is crucial to effectively analyzing data. While data can exist in diverse formats, not all formats are equally suitable for analysis in Alteryx Auto Insights – much is the case with Tableau. This article outlines the basics of preparing data for Alteryx Auto Insights, explaining in familiar terms for Tableau users.
Structuring Data
Why do I need to prepare and structure my data?
Quality in, quality out! Data preparation involves consolidating well-formatted data into a single table (or multiple tables, depending on the desired outcome) to facilitate analysis in Alteryx Auto Insights. This involves organizing data into structured rows and columns, as well as ensuring data cleanliness, such as ensuring the data types and values and values are accurate.
Data structure plays a significant role in the analysis. While it may be challenging to control the underlying structure of the dataset, access to the raw data and an Alteryx Designer license can help shape the data into a more suitable format for Alteryx Auto Insights.
Much like Tableau, Alteryx Auto Insights works best with structured, transactional-level data that resembles a spreadsheet with data stored in rows and columns, and column headers in the first row. The definitions of rows and columns are important.
Categorizing data
Each column in a data table in Alteryx Auto Insights is treated as a field and must be assigned a data type. Data types help Alteryx Auto Insights understand the type of information in that field and, importantly, how to represent it best automatically. There are only three data types in Alteryx Auto Insights: fields must either be a Measure, Segment, or Date. Alteryx Auto Insights will attempt to identify, based on the sample attributes in the column, if the attribute is best presented as a Measure, Segment, or Date.
Definitions of
Measure in Alteryx Auto Insights: Quantitative attributes that can be measured and recorded with numeric values. Examples of Measures include Sales, Revenue, Expenses, Cost, Clicks, and Scores. Measures are attributes that can be aggregated over time. Alteryx Auto Insights automatically aggregates measures using a SUM expression.
Segment in Auto Insights: Qualitative attributes that serve as descriptors or categorical values for a dataset. Examples of Segments include States, Team Names, Company Names, or Unique IDs (Employee IDs, Transaction IDs, and more).
Tip: If you’re unsure if your field is a Measure or a Segment, whether it makes sense to use the prefix ‘Number of’ in front of the field name, it should be treated as a Segment in Auto Insights. For example, if we wanted to determine how many employees an organization had, we would count the number of Employee IDs.
Nuances in categorizing data between Alteryx Auto Insights and Tableau
In Tableau, users have the discretion in treating fields as discrete or continuous, with Dimensions usually considered discrete and Measures continuous. However, in Alteryx Auto Insights, Segments are treated as discrete, while Measures and Dates are continuous. In Alteryx Auto Insights, the data type (discrete or continuous) of a Measure, Segment, or Date cannot be changed by the user.
Note: When working with time series data in Auto Insights, only the Date field/s can be used as the axis, resulting in a single, unbroken trend line based on the consistency and continuity of the date attributes.
Ideal data structure for Alteryx Auto Insights
Much like Tableau, Alteryx Auto Insights prefers “tall” data with fewer columns and more rows.
Example of wide data – not suitable for Auto Insights
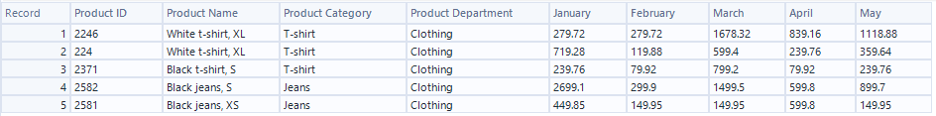
Consider the sample Retail Sales dataset below. There are columns for product attributes (ID, name, category, department) and a separate column for each month’s sales. Each cell represents the value of sales for that product and month, resulting in 12 columns of data representing sales.
While this format is easy for humans to comprehend and standard for a number of financial processes, bringing this data into Alteryx Auto Insights creates a distinct field for each month. Instead of a single field representing time, there are multiple fields (for example, January, February, March) representing the same attributes (sales). This structure makes it impossible to analyze the data over time in Auto Insights, as it is stored in separate, non-comparable fields.
Tip: If your column headings serve as additional context (for example, the month the sales relate to), this indicates the data must be pivoted.
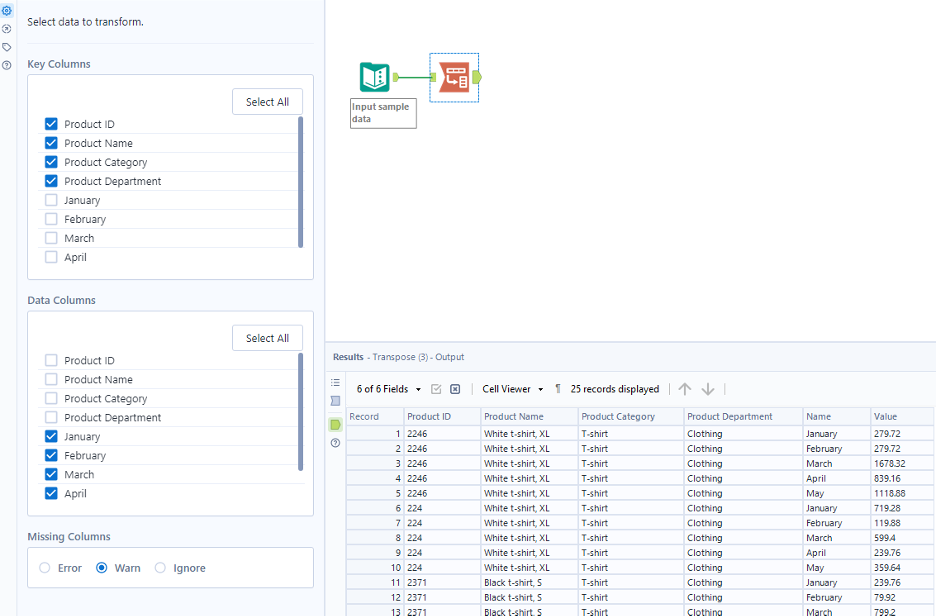
How to reformat a dataset to tall data – suitable for Auto Insights
If we pivot the data, we reshape the data from wide to tall. Rather than having a column for each month, we have a single column, Month, and a new column, Revenue. In this format, we have 25 rows and 6 columns. This data is better suited for Auto Insights, however, it isn’t truly time series data, as we only have the month component of the entire date.
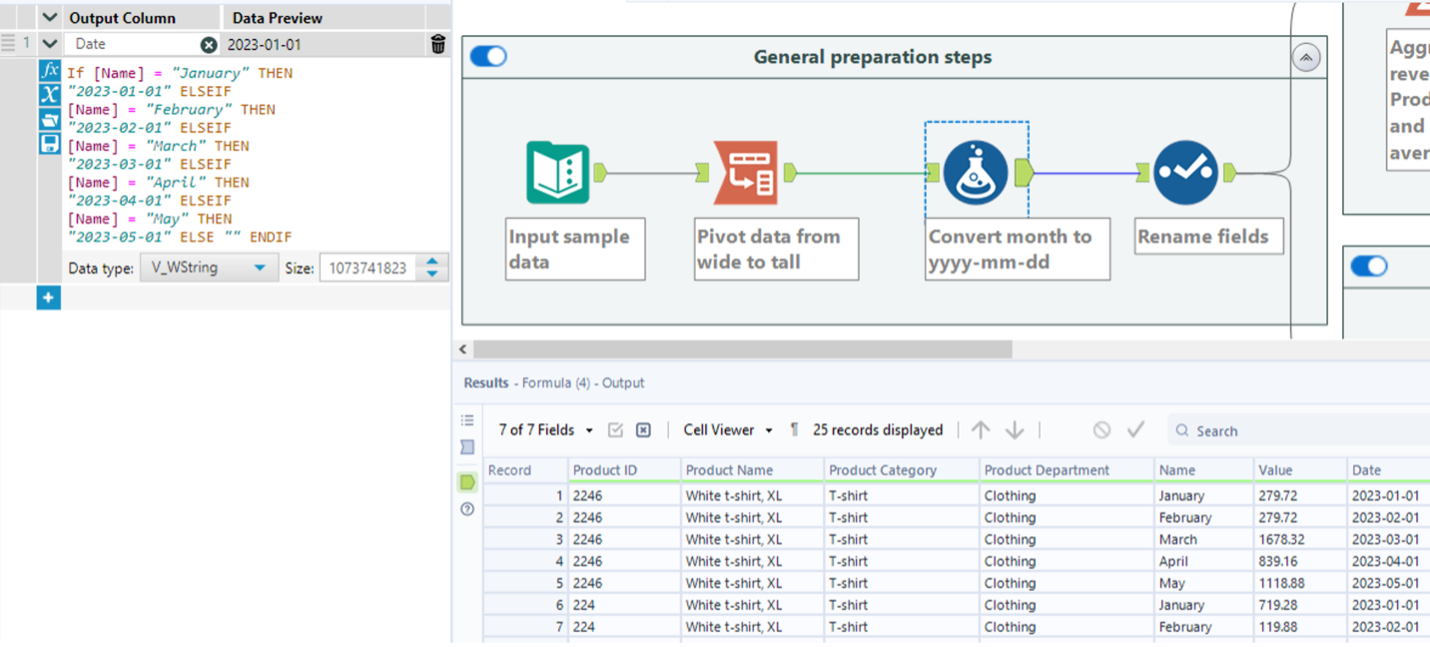
We can use a formula tool to reformat the date field as appropriate. In this example, all dates relate to 2023, which the formula reflects.
Now you’ve read this data, you’re ready to work with Auto Insights on your data!
Finally, we can enrich the data further by using a Text to Columns tool to split the attributes in ‘Product Name’ into two columns – one reflecting the size of the product, and the other reflecting the product name.
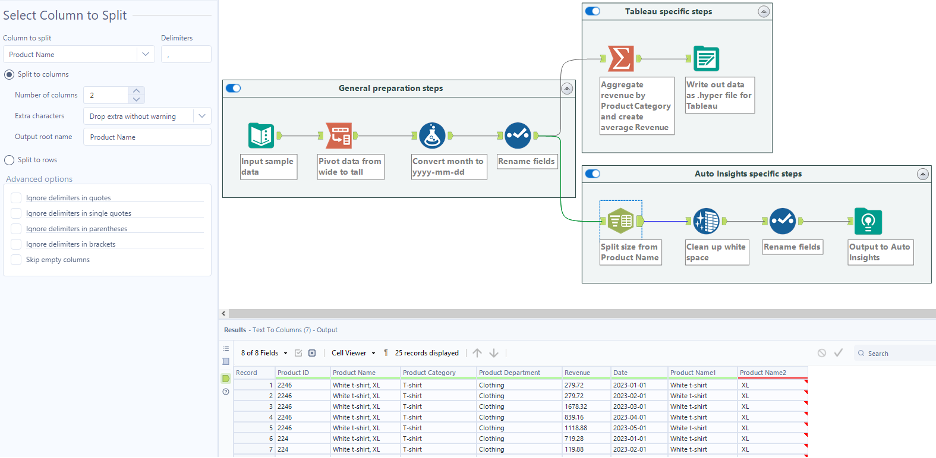
Workflow outputs will differ for Auto Insights compared to Tableau
Finally, depending on the use case for Tableau, a user may choose to aggregate their data prior to outputting it to Tableau. By contrast, Auto Insights works best with the lowest level of granularity (transactional level) data.